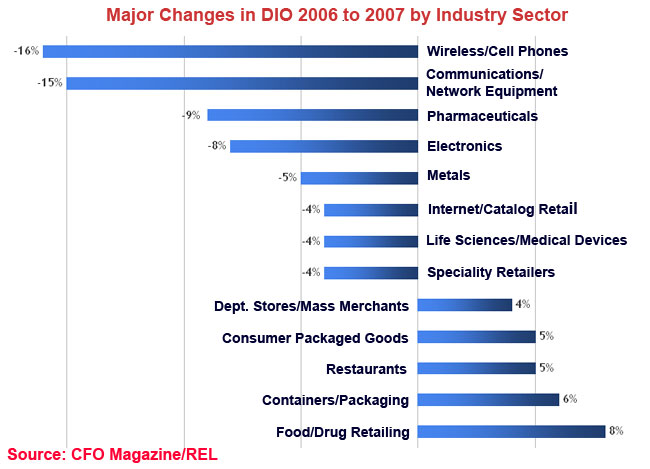
The industry sectors have to be taken with a grain of salt as well, as in some cases there are very dissimilar types of companies lumped together in a sector, or else the category is very broad. This is probably most notable when there are substantial differences in DIO between companies in a sector. For example, Anheuser-Busch, with a DIO of 16 in 2007, is in the beverage category along with spirits maker Constellation Brands, with a DIO of 136. The specialty retail group includes a wide array of companies, including auto parts retailer Auto Zone (DIO of 119) and apparel retailer Abercrombie & Fitch (DIO of 32).

Individual Company Performance
We also took a look at companies that have either strong or weak DIO performance. Another caveat: DIO simply captures an end-of-year snapshot, and sometimes inventory moves at that time mask real performance over the course of a full year.
For example, when you see a company like bio-tech firm Celgene, where DIO dropped 25% 2005 to 2006, then went back up 24% 2006 to 2007, you suspect there was just some noise in the numbers.
We especially looked for companies that had strong performance for two consecutive years.
One such example is chemical maker Celanese, which decreased DIO from 45 to 41 to 36 in 2005-07, representing decreases of 8% and 13% respectively in 2006 and 2007.
Eastman Chemical had a major improvement in 2007, reducing DIO from 37 to 29, or a 22% decrease.
In the auto parts industry, Cooper Tire must be doing something right, and is known to have invested in supply chain and inventory management technology in recent years. Cooper reduced DIO from 55 to 48 to 38 in 2005-07, consecutive decreases of 13% and 21%.
In the networking space, Cisco is also doing something right, reducing DIO from 19 to 18 to 14 in 2005-07, or decreases of 8% and 21% in that time.
Chiquita must be figuring out how to make even more improvements to its legendary banana supply chain, moving DIO from 22 to 20 to 17 2005-07, or decreases of 13% each year.
In the general retail industry, Family Dollar is making progress, reducing DIO from 68 to 59 to 57 in 2005-07, or decreases of 13% and 4%. In a sector where progress is tough, department store chain Nordstrom went from 45 to 43 to 40 over the same period, or decreases of 6% and 7% consecutively.
Cosmetic maker Revlon has also made progress, reducing DIO from 60 to 51 to 44 in 2005-07, or 15% and 14% consecutively.
Specialty retailer Game Stop also has faired well, dropping DIO from 71 to 46 to 41 in 2005-07, decreases of 35% and 11%.
On the lower performance side, there must be something going on in the soda industry. Coca-Cola saw DIO rise from 22 to 25 to 28 from 2005-07, or increases of 13% and then 14%. Bottler PepsiAmericas saw a similar pattern, going from 19 to 21 to 23 in 2005-2007, or increases of 9% and 13%.
In computers, even before Dell’s changing supply chain strategy announced this year that was going to involve much more make-to-stock business, it’s nascent 2007 moves into some areas of retail seem to have had an effect on DIO. Dell’s numbers went from 3.8 to 4.2 to 7 2005-07, or increases of 9% and 68% respectively.
Meat producer Pilgrim’s Pride is also seeing DIO increase, rising from 34 to 41 to 46 in 2005-07, increases of 20% and 13%, respectively.
Kimberly-Clark also saw an increase in DIO, perhaps reflecting its roll-out of its “Network of the Future,” which should ultimately reduce inventories, but which may have increased during the transition. DIO went from 40 to 44 to 49 in 2005-07, or increases of 9% and 12% consecutively.
Shoe maker Timberland is also going the wrong way, with DIO moving from 39 to 43 to 51 in 2005-07, increases of 12% and 18%.
These are just some highlights. Many other companies on both sides of the ledger could have been cited. The full report is available at the CFO site: 2008 Working Capital Report.
Any reaction to these inventory numbers? Is DIO a good metric to track? Let us know your thoughts at the Feedback button below.
|