Graphs
Tell the Story
The graphic
below tells an interesting story. Over the
same time frame (basically, the past 12
months), the three charts illustrate: (1)
the fall of the US dollar (shown by the
rise in the value of the Euro versus the
dollar); (2) the rise in crude oil prices;
(3) and the rise in a broad basket of commodity
prices as represented by the Morgan Stanley
commodity index.
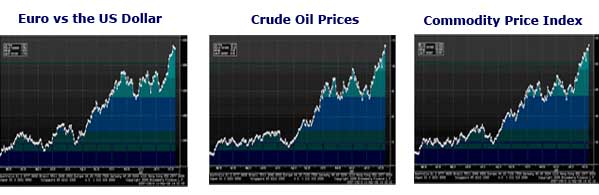
It’s
hard not to draw the conclusion that the
falling dollar is driving the rise in both
oil prices and other commodities. The similarity
of the graph trajectories is remarkable.
“I
think that many investors and speculators
are investing in commodities in order to
hedge against the falling dollar and not
necessarily because they participate directly
in the commodity markets as a consumer or
supplier of the underlying commodity,”
Kauffelt wrote.
On
a related note, a Wall Street Journal editorial
this week noted that “strong world
growth explains part of the commodity price
this decade. But the dollar price of oil
has surged by some 60% since September,
even as US
growth has slowed sharply.”
Both Kauffelt
and the Journal also note the investors
and speculators are driving commodity prices
up as they flee dollar-based investments
(bonds, etc.) to investments in “harder”
assets such as metals and other commodities.
While supply
managers have always had interest in the
value of the dollar as it pertains to the
net cost of goods that can be sourced around
the world, increasingly, it appears the
link between the dollar and commodity inflation
needs to be better understood.
Is the falling
dollar the key driver behind recent commodity
inflation? Or are the charts just a coincidence?
Let us know your thoughts at the Feedback
button below. |