sc digest
 
August 16, 2012 - Supply Chain Newsletter
border

This Week In SCDigest

bullet Inventory Performance 2012 bullet SC Digest On-Target e-Magazine
bullet Supply Chain Graphic of the Week and Supply Chain by the Numbers bullet This Week In "Distribution Digest"
bullet New Cartoon Caption Contest This Week! bullet Trivia
bullet New Expert Contributor bullet Feedback

FEATURED SPONSOR: Kewill


Now Available On Demand
Managing Your Shipping Costs: From Mailroom to Boardroom
Invest 12 minutes Now to Learn about Kewill Netship and Start the Savings!
 
 
first thought

Inventory Performance 2012

For the last several years, I have been doing reporting and analysis on company and sector inventory levels based on the annual Working Capital scorecard that is compiled by REL, a division of the The Hackett Group.

It is always one of our most popular columns of the year.

GILMORE SAYS:

"Of note, retail inventory levels have recently been declining, while manufacturing and wholesale inventories are rising."

WHAT DO YOU SAY?

Send us your
feedback here

Once again this year, REL has been kind enough to send me the data set for some further analysis. The just released 2012 data (a little later than usual this year) is based on year-end 2011 financials from hundreds of US public companies.

The full report and data set looks at the full spectrum of working capital: Days Sales Outstanding (DSO), Days Inventory Outstanding (DIO), and Days Payables Outstanding (DPO). Here, we are going to focus on just the inventory component.

DIO means how many days of sales a company is holding in inventory, and which REL defines as:

End of Year Inventory Level/[total revenue/365]

I want to make clear this is the definition REL uses in its data set. Every year, someone writes in telling me why I am wrong here, and my response is that this is the way REL calculates DIO, so that is what I must therefore use (and I think it is fine anyway).

As such, DIO is sort of the reverse of inventory turns, in that a higher DIO, all things being equal, means poorer inventory management performance, while a lower number signals improvement. You are being more efficient with inventory versus a given level of sales.

So, let's take an example. Amazon.com had about $48 billion in sales in 2011 (wow). Divided by 365 days in a year, that means the company sold about $131 million worth of stuff per day. It also ended the year with $4.992 billion in inventory. So dividing that inventory number by the $131 million in sales per day means Amazon holds on average inventory equal to about 38 days of its sales. McDonald's, by contrast, manages to hold just about 2 sales day's worth of inventory (I assume franchisers hold much of the inventory in the chain, though the restaurant category has the lowest overall DIO); Goodyear Tire holds 62 day's worth.

In case you were curious, Amazon's 38 days of DIO could be compared to its inventory turns level of 7.46 days (Cost of Goods Sold divided by inventory levels). But you can by no means say every company with DIO of 38 has inventory turn of 7.5%. The margins/cost of goods sold vary by company.

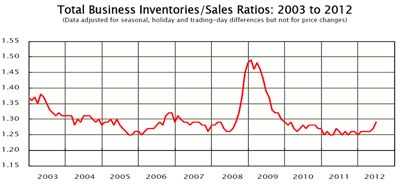
In the overall US economy, inventory levels have remain relatively flat since about 2005. As seen in the chart below, the "inventory to sales" ratio did spike in late 2008/early 2009 as the recession caught companies with way more inventory than needed versus suddenly shrinking demand, but they then chopped away at that inventory ruthlessly, so that it was back on the longer term trend line by early 2010.

Just recently, the numbers have started to inch back up a bit, to a level of 1.28 in June (the most recent number), typical in a recovering economy. It is still well below levels prior to 2005, as supply chain management effectiveness and greater corporate focus on inventories have combined to drive the levels of inventory down overall, though we may have reached a plateau. Of note, retail inventory levels have recently been declining, while manufacturing and wholesale inventories are rising.

Now, back to the REL data. The biggest value add we perform here is to re-sort individual companies into new categories, so the categories and comparisons in our view are more usable for supply chain thinking. For example, home builders like Toll Brothers were mixed in the household durables category with companies like Whirlpool. That may have been the most "apples and oranges" combination, but there were a number of others that didn't quite jive, at least from a supply chain perspective. Metal producers such as US Steel were in the same category as miners.

So, we do the hard work of first eliminating sectors that aren't useful for the supply chain (e.g., bankers, etc.), and then redefining and populating the categories in a way that makes more sense for the supply chain. As another example, rather than having one category of all specialty retail, we broke that down into apparel, office products, etc. It really does take some time.

It is far from perfect. Should SuperValu be placed with grocery retailers, or the food wholesalers category, as it does a lot of both? Is Honeywell in the aerospace or automotive sector, or maybe even one of the few "industrial conglomerates" like GE or 3M?

In the end, we simply made choices, including looking up more details on a number of companies with which we were not familiar, and calculating the data ourselves for a handful of notable companies that were missing for some reason (e.g., Lowes).

So all that doesn't leave me much room here. You will find a complete table of the 49 categories we used here, ranked from lowest DIO to highest, and the change from 2010 to 2011: DIO By Sector 2012. Note: you may have to "zoom in" in your browser to see it well.

Top 5 lowest DIO: (1) Restaurants 8.0; (2) Soft Drinks/Beer 21.7; (3) Retail Grocery 23.3; (4) Network Equipment (e.g., Cisco) 24.4; (5) Computers 27.3.

Top 5 highest: (49) Spirits 171.7; (48) Retail Auto Parts 105.1;(47) Aerospace/Defense Components 90.1; (46) Retail Other Specialty (e.g., PetSmart) 89.0; (45) Retail Home Products (e.g., Bed Math & Beyond) 72.6.

Three best performing sectors (biggest drop in DIO from 2010 to 2011: (1) Spirits -13.8%; (2) Food Ingredients -12.8%; (3) Soft Drinks/Beer -10.5%.

Three worst performing sectors (largest rise in DIO): (49) Restaurants 16.0%; (48) Aerospace/Defense OEMs (e.g., Boeing) 10.6%; (47) Semiconductors 9.2%.

Note the companies cited as examples could have seen changes different from overall sector average.

In our On-Target newsletter next week, we will provide even more detail in this data. Also, REL provided only two years worth of data this year instead of the usual three, but I am going to see if we can combine that with last year's data to provide a more multi-year view (it will be a big effort, actually.) Next week, we will also look at which individual companies made big progress, such as Monster Beverage, which managed to drop DIO from 43 to 33 days last year, an improvement of 22%. Nice job.

We'll also detail which companies are in which sectors. Look for that next week.

REL says the top 1000 US-headquartered public companies still had over $910 billion tied up in working capital capital in 2011, much of that in inventory, and that there are major opportunities for many companies to capture some of that as cash.

We agree.


Any reaction to this year's inventory numbers? What other analysis would you like to see? Let us know your thoughts at the Feedback button below.


SUPPLY CHAIN NEWS BITES

Supply Chain Graphic of the Week:

The New Supply-Demand Challenge


This Week's Supply Chain by the Numbers for August 16, 2012:

  • JC Penney's Bold RFID Move
  • Beat Up Those Suppliers is Top Cost Strategy
  • Amazon Locks Up a New Fulfillment Approach
  • Clopay Closes the Door On Good Inventory Year

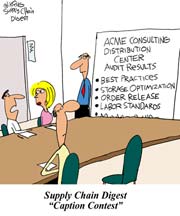
NEW CARTOON CAPTION CONTEST BEGINS THIS WEEK

August 13, 2012 Contest


See The Full-Sized Cartoon and

Send In Your Entry Today!


ONTARGET e-MAGAZINE

Weekly On-Target Newsletter:
August 15, 2012 Edition


New Cartoon, WMS Trends, JC Penney RFID, Q2 Rail Results and more


ON DEMAND VIDEOCAST AVAILABLE FROM KEWILL


Invest 12 minutes Now to Learn about Kewill Netship and Start the Savings!


Holste's Blog:


DC Productivity Improvement Opportunities Abound in Older Operations


TOP STORIES ON
DISTRIBUTION DIGEST

TOP STORY: Key Trends in WMS and Supply Chain Execution Technology (Part 1)

TOP STORY: Amazon to Add 18 New Distribution Centers Worldwide in 2012. as It Keeps Investing in Logistics

TOP STORY: SCDigest, Warehouse Education and Research Council, Announce New Distribution Center Complexity Calculator


NEW EXPERT INSIGHT

Global Supply Chain Comment: Cargo Security Needs to Start with Contents Verification at the Shipper

By James Giermanski,

President

Powers International, LLC

and

Chris Giermanski

Director of International Operations
Transportation Services Inc.


SUPPLY CHAIN TRIVIA

About how many US distribution centers of all kinds does Walmart operate in the US?
Answer Found at the Bottom  of the Page

Upcoming Videocast:


Achieving Powerful Results at Medtronic with SAP Enterprise Inventory Optimization


Detailed Case Study Supported by Educational Overview of Inventory Optimization Software


Featuring
Tim Boos, Sr. Program/Project Manager, Medtronic, Dave Strothmann, Senior Director, SCM Business Development, SAP

On Demand Videocast:


FleetPride Enhances Customer Service and Profitability through Innovative Supply Chain Transformation


Wholesale-Distributor Implemented
A New Approach to Supply Chain Improvement that Drives Corporate Objectives Without Installing Software

Featuring Steve Fogolini, Director of Supply Chain, Fleetpride and Gaurang Pandya, Vice President, Industry Strategy, JDA

MAJOR RESEARCH PROJECT

Last Chance! Survey Closing Soon

Important Research on US
Manufacturing and Reshoring

MIT and SCDigest Need Your Help!


Participants Receive New Report from MIT's Dr. David Simchi-Levi, Copy of Results and More

Can you please help by taking this quick 15 minute survey? All respondents will receive a summary of the data
in just a few weeks.

Tuesday, August 28, 2012


Now Available On Demand


YOUR FEEDBACK

We are admittedly way behind on Feedback, but this week we are going ahead and publishing several of the strong number of emails we have received on David Schneider's guest First Thoughts column last week on "The One Best Supply Chain Metric." That piece argued that Operating Cash Flow (OCF) is the most meaningful and potentially transforming metric that can be used.

We've exceeded the usual number of responses for a FT's piece, somewhat depressing SCDigest editor Dan Gilmore, but he is trying not to dwell on it.

The Feedback of the Week is from our friend Kevin O'Meara, former AMR Research executive now involved in a number of other pursuits. He very much likes the concept. A couple of others aren't so sure.


Feedback of the Week: On One Best Supply Chain Metric -
 
commaBravo! on the article referencing Operating Cash FLow (OCF). This is a fantastic topic, one which is not understood well (by many business people, not just supply chain managers) and is a timely topic. Your point on the fact most supply chain managers do not manage a P&L (even though they call it that) is spot on as well.

I have a saying which I tell my finance people all the time when I ask them for cash flow metrics: "A P&L / income statement becomes 'impure' as soon as an accountants hands touch it!". The maneuvering over what is capitalized and what is not, what will be accrued for and what is not etc. etc. makes it almost (I am obviously embellishing here to make a point) a fictional document. Cash flow tells you what is really happening. And, cash flow from operations (versus financial and investing) is the king metric for a supply chain manager.

May I make a suggestion: Run a series of articles which starts with just what is cash flow, what are the three and how are they calculated. Then it would go into why (in more detail) it is so important and finally what are some things a supply chain manager can do to improve it.

For example, a supply chain manager would have a far better appreciation of the trade off of transportation cost v. speed to market if they understood the impact on operating cash flow when they compress the cash to cash cycle. So many I have seen will go for a lower transportation cost even at the expense of a much longer cash to cash mainly because they are measured on expense and have no accountability to OCF.

Anyway, just my thoughts. A great article and I would love to see more. comma

Kevin O'Meara


I understand the value of measuring OCF but, if used as a metric or goal, how do you reconcile when cash is used to pay down debt or make a major purchase? That will drive down the OCF but not because of poor performance.

Dwayne A Wildhagen C.P.I.M.
Manager Demand Forecasting, Planning & Product Configuration
Springs Window Fashions, LLC

Editor's Note: What I believe David is saying is that you only measure OCF that is impacted by the supply chain, not financial activities such as you suggest.

No doubt, this could require some special accounting efforts.  Many companies also do report cash flow from operations separate from financial and other areas.

Dan Gilmore


I do not buy all of what you are suggesting here. So much of what happens on the sales front can impact the supply chain. Using OCF has so many variables that it would cause to much debate in this company.

Rick Sawyer
Vice President, Supply Chain
Marks Supply Inc.

Editor's Note: Same basic answer as the above letter. Agree if those other factors cannot be separated out there are issues.


Great for you to cover such a topic. I have been on this theme for awhile. Large corporates have to act as a bank, whether they want to or not. Too many external forces are driving us this way. Banks, in being the primary originators of trade finance assets, are facing challenges like never before. Revisions to capital based regulation (Basel Accords) as well as changing regulations (Dodd Frank and FASB accounting regulations among others) are creating significant balance sheet pressures.

Corporations have two major assets on their balance sheet to finance, Receivables and Inventory. A Non Investment Grade corporate really has two options to finance these assets, self-fund or use bank credit. My analysis has shown most is self-funded. If you do not have a handle on your operating cash flow, how can you manage shortfalls or surpluses.

This will be an ongoing story, with some interesting developments.

David Gustin
President, Global Business Intelligence


SUPPLY CHAIN TRIVIA ANSWER

Q: About how many US distribution centers of all kinds does Walmart operate in the US?

A: 129, by the latest count we can come up with, though we may be behind on one or two. Texas leads the way with 15 facilities.

© SupplyChainDigest™ 2003-2012. All Rights Reserved.
SupplyChainDigest
PO Box 714
Springboro, Ohio 45066
POWERED BY: XDIMENSION