As usual, last week I produced a review of the key themes and trends in supply chain in 2015.
Earlier this week in our OnTarget newsletter, we offered a month by month timeline of key news and events in supply chain for the year. It's worth a quick review. We have a hard enough time remembering what happened last year and we do this for a living.
So now one last review of the supply chain year that was in what I call numbers and charts.
Gilmore Says: |
 Diesel prices started the year at about $2.88 per gallon�- down more than $1.00 from the start of 2014 - and ended the year at about $2.23. Diesel prices started the year at about $2.88 per gallon�- down more than $1.00 from the start of 2014 - and ended the year at about $2.23.

Click Here to See
Reader Feedback
|
The US economy as noted last week was once again lukewarm, with likely full year real GDP growth of right around 2%, ending with what appears likely will be a very soft fourth quarter when estimates are released in coming weeks.
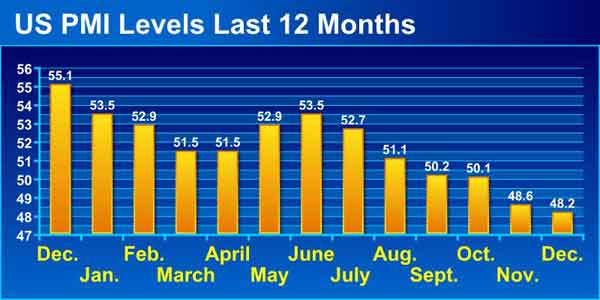
Indicative of that is the Purchasing Managers Index from the Institute for Supply Management, which measures manufacturing activity. In November, it fell below the 50 mark that separates expansion from contraction after 35 straight month of growth. It fell a bit further in December, capping six consecutive months of decreasing numbers as shown in the chart below. This isn't good.
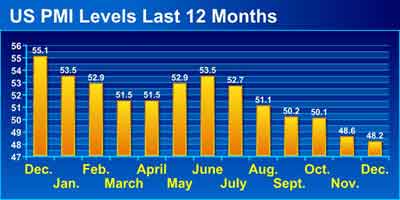
See Full Size Image Here
The new orders index - a barometer of future manufacturing activity - followed a similar trajectory, trending down sharply in the last half of the year and also showing contraction in the last two months after a long streak indicating expansion.
The PMI data was generally consistent with manufacturing production levels as reported each month by the Federal Reserve. First, we will note that in July, the Fed changed the baseline year for the index from 2007 to 2012, giving the average month in that year a score of 100. Who knows why they make such changes, but it is interesting because 2007 actually had higher US manufacturing output than was reached in 2007, the peak year of output that amazingly we still have not exceeded eight years later.
As can be seen in the chart below, the index hit bottom in June 2009 at a level of about 85 (meaning 15% below 2012 levels), and has climbed slowly but steadily from there. But as can be seen, and consistent with the PMI numbers, the index has really flatlined in the last half of 2015 (we are still awaiting the December number).
While the overall manufacturing index is thus about 6% above 2012 production, there are huge differences in that recovery by sector, which we will detail in coming weeks in OnTarget.
Oil prices of course continue to head almost unbelievable downward. The trend started in last quarter of 2014, and we ended that year at about $50.00 per barrel for US West Texas Intermediate (WTI) after having been as high as $107 that summer.
As can be seen below, WTI railled a bit in 2015, hitting a high of about $63 in late April, before heading consistenty down beginning in July and ending the year at about $37.00. Who could have possibly seen this coming? Diesel prices naturally followed suit, starting the year at about $2.88 per gallon - down more than $1.00 from the start of 2014 - and ending the year at about $2.23. As I noted last week, this help offset rapidly rising US truck rates in most 2015, especially in the first half of the year.
WTI Oil Prices in 2015
Other commodity and input costs continued downward in 2015, extending the general trend that began in 2011 after years of increases in commodity costs, which were frequently cited in the 2000s as the cause of corporate profit woes. but which accelerated starting in mid-2014. The IHS Material Price Index is down about 55% since July 2014, as shown below, bacl almost down to levels seen at the bottom of the Great Recession in 2009. Amazing.
Freight volumes were up modestly, in tune with the overall economy. Through November, the ATA Truck Tonnage Index was up 2.7% year-over-year. At an index level of 134 for November, that means tonnage that month was 34% above the 2000 baseline year. Cass information Systems says 2015 freight volumes were generally weak in 2015 though, up slightly in the first few months of the year but then tailing off from there, and Cass says we are now back to 2013 freight volumes after a robust 2014.
Truckload rates started rising sharply in the first few months of the year - up 7.9% and 6.6% year-over-year in January and February respectively, according to the Cass Linehaul Index, but they trended down from there. Increases stayed in the 3.6% range from April through September, before dropping to the 1-2% range for the last three months of the year - yet another data point indicating an economic slowdown in Q4. The Cass Index is shown over many years in the graphic below, which says rates are currently up about 27% since the baseline month of January, 2005. That's an average annual increase of 2.2%, by the way.
Rail volumes shrank, with total units down 2.5%, according to the Association of American Railroads. Traditional car loads were down 6.1%, mostly on continuing drops in coal traffic, but intermodal cars were up just 1.6% for the year, far below most recent periods. There was some evidence that low diesel prices were leading to diversion of some freight from rail to truck.
On the ocean shipping side,
preliminary numbers show US ports handled 218.2 million TEU in 2015, up 5.4% from 2014, including both imports and exports.
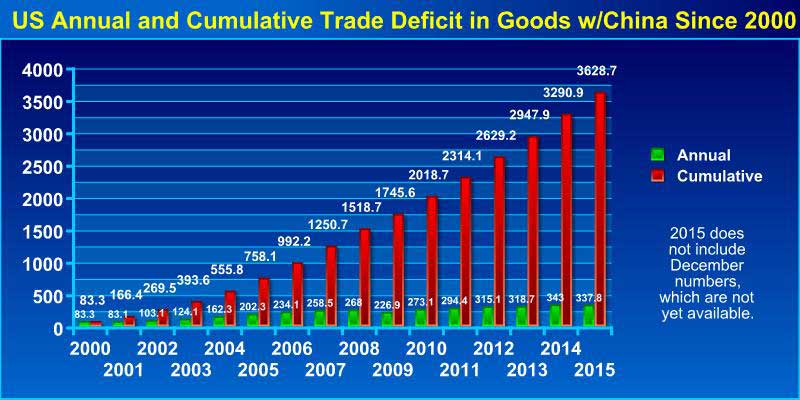
The US trade deficit rose 5.5% through November, to a total of $488 billion, even as oil imports slowed dramatically. Of course, as usual the story was even worse for "goods," where the trade deficit was an astounding $696 billion through November, another record pace. Roughly half of that deficit in goods is in trade with China, where the deficit was $337 billion through November, and will again set a new record for the year, surpassing the 2014 mark of $343 billion for the full year. Where is the reshoring?
The cumulative US trade deficit with China in goods since 2000 is now some $3.6 trillion, as shown in the graphic below.
The growth of ecommerce sales rolled on, up 14.8%, 14.3% and 15.1% in Q1 through Q3, respectively, year over year, as we await the Q4 number from the Commerce Dept, with Q3 on-line sales of about $87.5 billion. That is still under 10% of total retail sales (and there are different ways to calculate that percentage), but ecommerce's share is obviously much higher in some categories. Amazon's is somehow growing even faser, with increases in merchandise sales in the mid-20% range in 2015, and it will end the year with revenue of well more than $100 billion when it reports at the end of the month. Still, it struggles to make a profit, with earnings of only $114 million through Q3, basically breakeven on sales of $71.2 billion in sales in the first nine months of 2015.
Overall retail sales were up only about 1.3% for the year, including inflation, as the retail transition to on-line continues.
I have lots more but am out of space.
Any reaction to our review of supply chain 2015 in numbers and charts? Is it of interest to you? Let us know your thoughts at the Feedback button or section below.
|

