From SCDigest's On-Target E-Magazine
- June 6, 2012 -
Logistics News: Annual DC Metrics Report Released at WERC Conference; Time for More Focus on Soft Metrics?
Key Takeaway: Core Operational and Financial Performance Converging from Top to Bottom Performers
SCDigest Editorial Staff
As always, the annual DC metrics report was unveiled at the Warehouse Education and Resources Council (WERC) conference a few weeks ago in Atlanta.
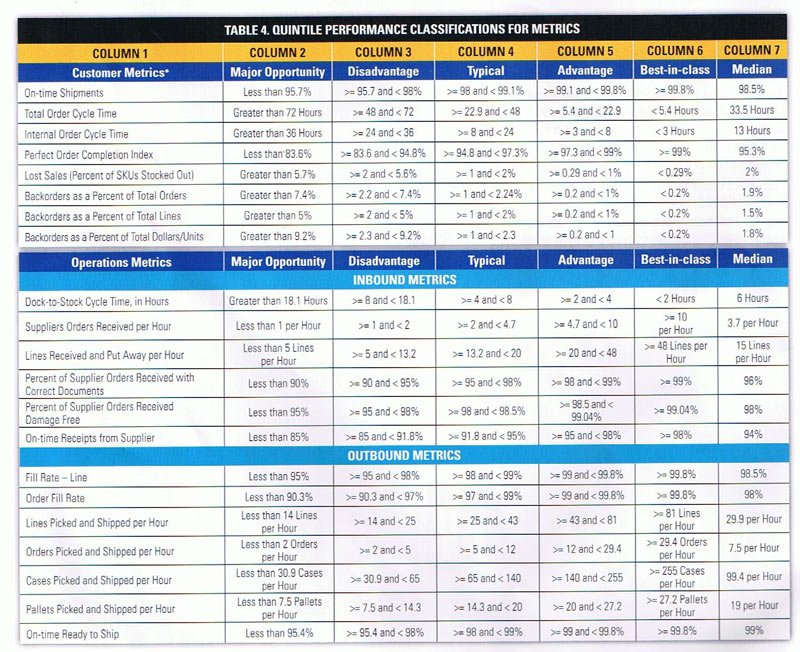
With the effort once again led by Dr. Karl Manrodt of Georgia Southern University and Kate Vitasek of consulting firm Supply Chain Visions, the ninth year for the report as always covers a of ground both on what metrics are being used and how companies are performing, but with a bit of a twist this year. In 2012, the authors say that given the general shrinkage in the gap between top and middle level performers, it may be time to increase the focus on "soft" logistics metrics.
SCDigest Says: |
 |
| So as core operational and financial metrics in the DC continued to converge from top to bottom performers, do we need to look at a new set of measures? |
|
What Do You Say?
|
|
|
|
As usual, the survey respondents represent a broad range of both industry sectors and distribution models (e.g., piece picking versus case picking versus full pallet picking, and combinations thereof).
We are always interested in how companies consider their business and supply chain operations. This year, 38.7% said their main focus was customer service; 12% said it was cost leadership (be the low cost provider); and just 9.2% said the focus was on product/market innovation. That left the preponderance of 40.1% to say that the focus was to be "all things to all people," meaning companies are trying to be the best at cost, service and innovation. Whether this is really possible is an open question. The underlying point is that supply chain strategy and execution should be geared to support the overall business strategy.
Manrodt and Vitasek say this trend started to be first noticeable in 2007, when "all things to all people" first overtook "customer service" as the top choice for company/supply chain focus.
Top Metrics Used
One of the response areas we are most interested in each year is the most popular metrics companies use to measure distribution center performance.
There is a surprising amount of churn each year in terms of what metrics make the top 12, based on the percent of respondents reporting scores for what metrics, and the ranking within the top 12.
That said, the top 12 DC metrics for this year, and how that compared with the 2011 survey, is shown in the table below.
As can be seen, 9 of the top 12 metric for 2012 also made the 2011 list, though there was a bit of shuffling of position (even with on-time shipments staying at the number 1 spot for in both 2011 and 2012). The most dramatic change to us, and what we think must be some form of aberration, is that line fill rates dropped from third highest used metric in 2011 to number 10 this year –we believe 2011 was the more accurate position for this commonly used metric.
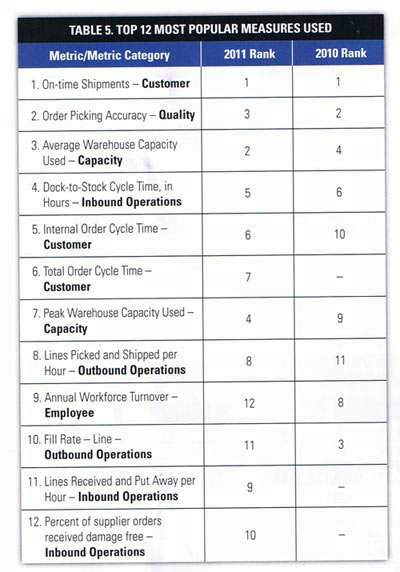
Source: WERC, Manrodt and Vitasek
(Distribution/Materials Handling Story Continues Below
) |