Dr. Watson Says: |
 |
| ...I've been amazed by how much value people get from just seeing their supply chain on a map... |
|
What Do You Say?
|
|
|
|
I’ve been involved in 100s of network design projects and have talked to 100s of more people about it over the last 15 years. While there is a lot of value in running the optimization and getting different solutions, I’ve been amazed by how much value people get from just seeing their supply chain on a map.
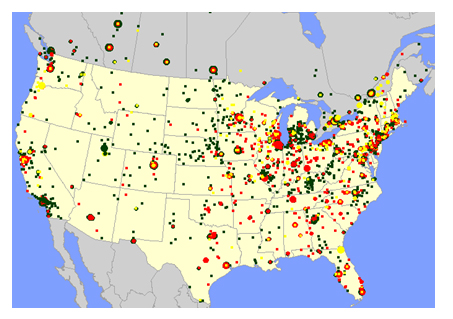
To stress the importance of mapping a supply chain in the classes I teach, I often use the following map of a company’s customers and ask the students to tell me about this company. Even though they don’t know anything about the company, they quickly see their customer base across the US and Canada, they quickly see that there are different types of customers, they quickly see that customers have different demand and so on. You can learn a lot with just one picture. If this was your company, and you could drill into the map, you could learn a lot more.

Previous Columns by
Dr. Watson |
|
|
For many people in companies, a network design project can be the first and only place they see their business displayed on a map.
And, when people do see it, interesting things happen—they gain a new understanding of their business, they come up with ideas for improvement, and they ask harder questions than they would have otherwise.
Since the mapping in a network design projects leads to so much value, you should considering providing this type of visualization on an on-going basis. You can get a lot more value if your organization routinely viewed the business with a map and had the ability to interact with the data and ask questions. This can be a much more powerful than just writing queries from your data warehouse to get a table of information.
This is where map portals come in. A map portal is a way to extend one of the benefits of network design—seeing your business on a map. A map portal is better than the maps in a network design tool because it is supported by detailed and live data. This allows you to drill down into the data, to see more information and new patterns, to more easily compare the actual results to the plan. |