Dr. Watson Says: |
 |
| ...a map is a great way to visualize a lot of information quickly. |
|
What Do You Say?
|
|
|
|
In a previous post, we discussed the different definitions of Big Data. In this post, we show you three simple ways you can start to analyze your supply chain Big Data set (however you define it).
Keep in mind that there are hundreds of ways to analyze your data. And, keep in mind that you will often need to invest in people, hardware and software, and new data sets to tackle new Big Data projects.
But, our goal here is to just get started analyzing the vast amount of data you already have. Without further ado, the three steps are:
1. Load your data into a database and run ad-hoc queries. This sounds basic, but I’m always surprised by how many supply chain teams aren’t doing this. Take your demand file or your transportation shipment file and just explore the data-- add up the total demand, total weight shipped, weight shipped by carrier, and so on. You will likely gain new insight and will possibly find new business opportunities. If you have Microsoft Access, use (and learn) that. You may need to learn some basic SQL to understand how to pull information from a database. As a side note, some MBA students I taught had taken non-technical summer internships where they were required to know SQL. This is a trend in the market—as data becomes more important, managers need to know how to pull this data on their own.
2. Run statistical correlations. This is the easiest of statistical analysis (besides calculating averages and standard deviations). A statistical correlation simply tells you how much one variable moves in relation to another. It gives you a scale of -1 to +1. A -1 means the two variables move exactly in opposite directions, a +1 means they move exactly together in the same direction, and a 0 means there is no relation between the two. You can easily do this in Excel. This can give you some insight into relationships you might not have seen before.
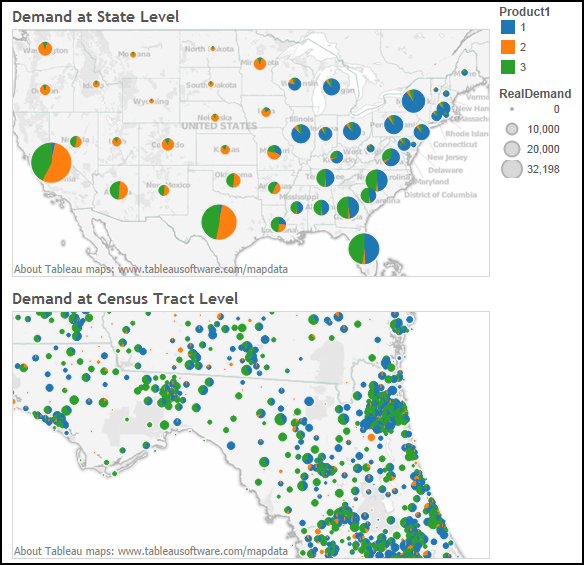
3. Map your data. A map is a great way to visualize a lot of information quickly. If you combine the map with some simple filters, you can analyze demand by different types of products or shipments by different modes. One thing to keep in mind is that the map should show different levels of information depending on the view. In the example in this blog (you can click on the map to go to a more interactive view of the data), we are showing total demand by state when looking at the whole US. When we drill into Florida, we are showing demand by census tract. On the national map, you can see that different products are sold in different parts of the country. This is just one example, you will have your own unique map views.

Final Thoughts
The supply chain team has access to a lot of data already. Before you start a new Big Data project, make sure you are analyzing the data you have.
|