Once again, SCDigest editor Dan Gilmore used his First Thoughts column to summarize the inventory performance numbers for 2011, based on data just released by REL, a Hackett Group company. (See Inventory Performance 2012.)
SCDigest Says: |
 An industrial distributor might choose to compete based on comprehensiveness of its SKU base (which would drive up DIO), while another may choose to carry a more narrow selection that might impact sales potential but deliver better inventory performance. An industrial distributor might choose to compete based on comprehensiveness of its SKU base (which would drive up DIO), while another may choose to carry a more narrow selection that might impact sales potential but deliver better inventory performance.

Click Here to See Reader Feedback
|
The full report and data set looks at the full spectrum of working capital: Days Sales Outstanding (DSO), Days Inventory Outstanding (DIO), and Days Payables Outstanding (DPO). As usual, we focus on just the inventory component.
DIO means how many days of sales a company is holding in inventory, and which REL defines as:
End of Year Inventory Level/[total revenue/365]
As such, DIO is sort of the reverse of inventory turns, in that a
higher DIO, all things being equal, means poorer inventory management
performance, while a lower number signals improvement. You are being
more efficient with inventory versus a given level of sales.
So, let's take an example. Amazon.com had about $48 billion in sales
in 2011 (wow). Divided by 365 days in a year, that means the company
sold about $131 million worth of stuff per day. It also ended the year
with $4.992 billion in inventory. So dividing that inventory number by
the $131 million in sales per day means Amazon holds on average
inventory equal to about 38 days of its sales.
However, as with most statistics, the devil is in the details. Amazon has a significant business doing e-commerce fulfillment for other companies, and generally does not own the inventory for those third party clients. So, its days of sales includes a lot of revenue for which it holds zero inventory, which may not be true for other e-commerce merchants. So, if we subtracted out the third party revenue and divided the inventory number by just the day's sales for its own internal business, Amazon's DIO would be higher.
Part of SCDigest's value-add is to take the full data set, which is based on information from the largest 1000 US public companies, and re-sort the individual companies in a way that makes more sense from a supply chain context.
So, just as an easy example, metal producers and mining companies are put in the same sector for analysis by REL. We broke out the metals manufacturers in a separate category, and made similar category changes (either adding categories or moving companies around) for many of the firms in the REL list.
That said, it is impossible to get that categorization completely right. Many companies are in several sectors, as an example. We frankly would have liked to break the large chemicals sector into commodity and speciality chemical categories, but that is just too difficult to do right now given changes in that industry where many companies are in both sectors.
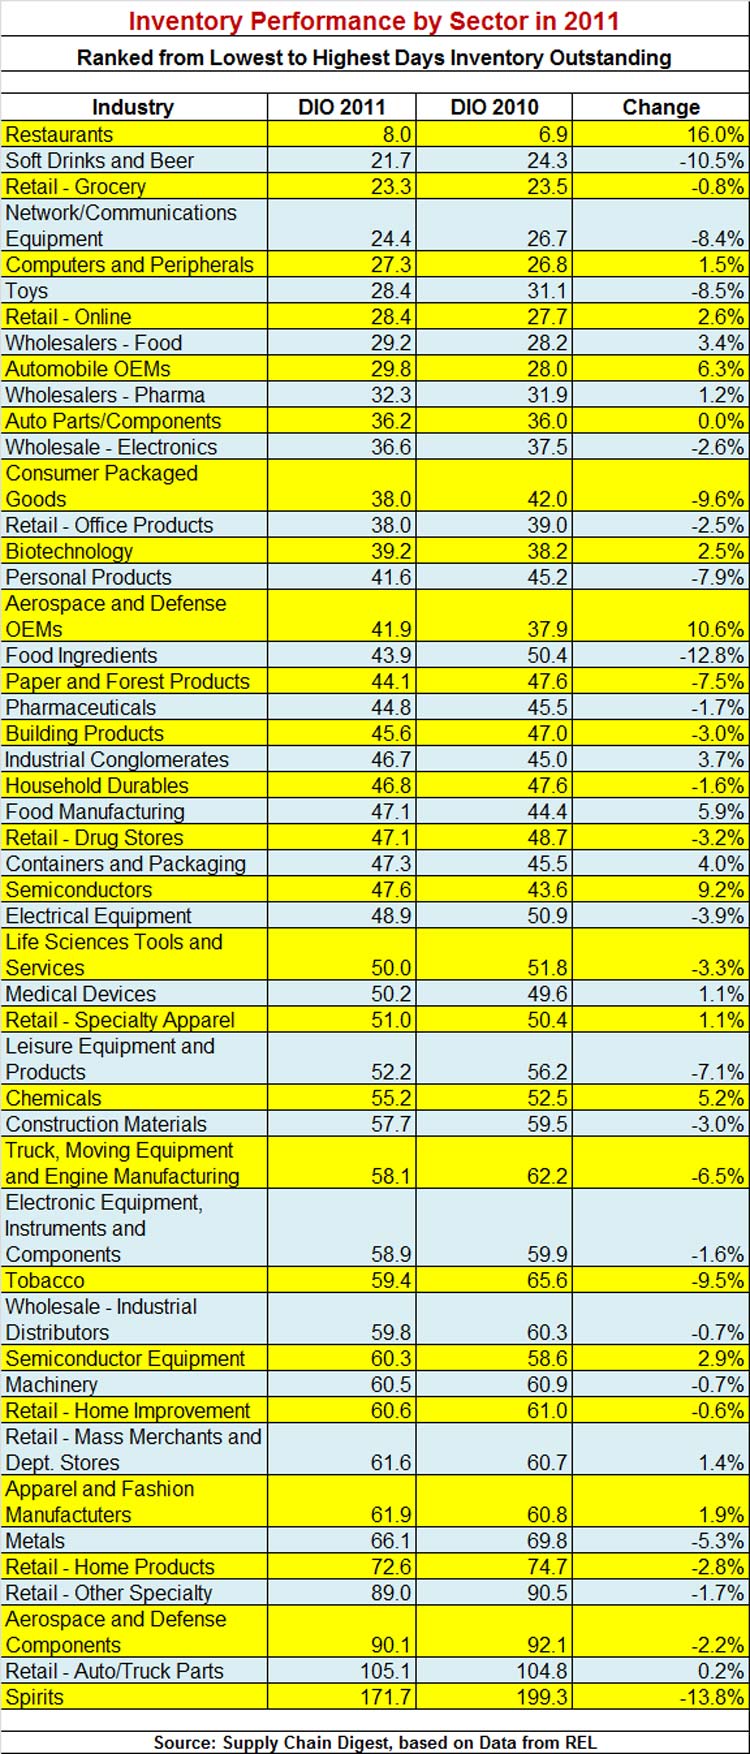
In Gilmore's column, we summarized results by sector in terms of DIO, listing the sectors from lowest DIO (restaurants, DIO of just 8) to highest (spirits, DIO of 171), as shown again in the graphic below, along with changes from 2010 to 2011.
(Supply Chain Trends and Issues Article - Continued Below)
|


