From SCDigest's On-Target E-Magazine
SCDigest Editorial Staff
Jan. 3, 2011
Major Macro Trends Impacting the Supply Chain in 2010
Most Indicators were Positive in 2009, but Weaker than Many Past Economic Recoveries; Factory Utilization Still well Below Historic Average, Despite 16 Straight Months of Manufacturing Growth
SCDigest Says: |
 |
| 2010 showed strong PMI numbers all year, and the 56.6 metric for November marked the 16th consecutive month the PMI was above 50 in the US. |
|
What Do You Say?
|
|
|
|
After the disastrous year of 2009, one of the worst economically since the Great Depression, 2010 was certainly a better time for most, though economic recovery remained wobbly, companies and consumers remained mostly wary and conservative, and developing markets were where most of the action was.
We will be doing a more in-depth review on the Year in Supply Chain later this week, but thought it would be good to kick off the new year with a series of charts from government data and other sources that offer a graphical review of 2010 along a series of macro data on the economy, retail spending, and other dimensions..
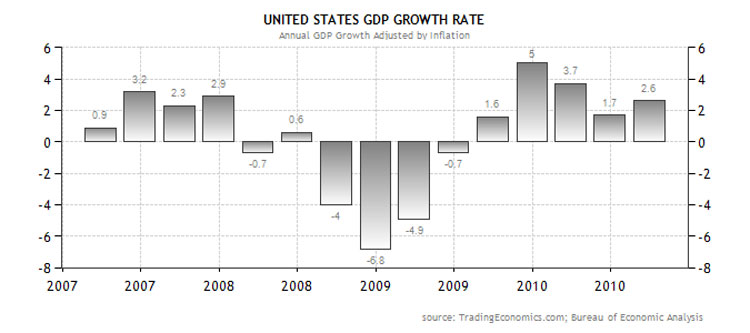
First up is US GDP, which as the chart below shows actually started to decline in mid-2008, before the financial crash, followed by steep drops throughout the rest of 2008 and 2009, with a significant 6.8% descrease in the Q4 of 2008 and two other really bad quarters on either side of it.
The first three quarters of 2010 all had positive growth, but yet weew very weak numbers by historical recovery standards. US economic growth was 3.7% in Q1 of this year, which was mostly attributable to signficant inventory rebuilding after the steep inventory descreases of 2009. Adjusted GDP growth was a dissappointing 1.7% in Q2, and a mediocre 2.6% in Q3. It appears likely, however, that Q4 numbers will be decent.
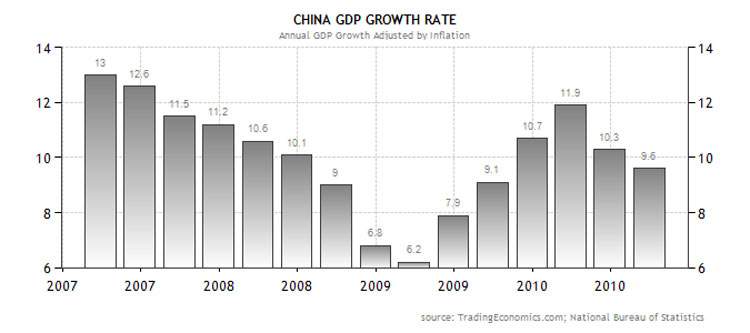
Compare that, however, to China's GDP number, also shown below. After several years of double-digit (though declining) economic growth, China's GDP bottomed at about 6% growth in Q3 2009,, as export volumes plunged, but quickly regained momentum in the last half of 2009 and moved back to double digit territory for most of this year, enabling China to pass Japan as the world's second largest economy.
Purchasing Manager's Index was Strong
The monthly Purchasing Manager's Index (PMI) from the Institute for Supply Management was strong and positive for all of 2010. The PMI represents a view of manufacturing actvity in the US and the measure bottomed out in late 2008, at a number not seen since the Great Depression at 32%. While the PMI began a long rise after that, it did not reach the critical 50 threshold, indicating manufacturing expansion, until the second half of 2009.
2010 showed strong PMI numbers all year, and the 56.6 metric for November marked the 16th consecutive month the PMI was above 50 in the US, though the rate of growth has dropped since earlier in the year. Update: The December PMI continued the streak, coming in at a strong 57 reading for the month, indicating accelerating growth.
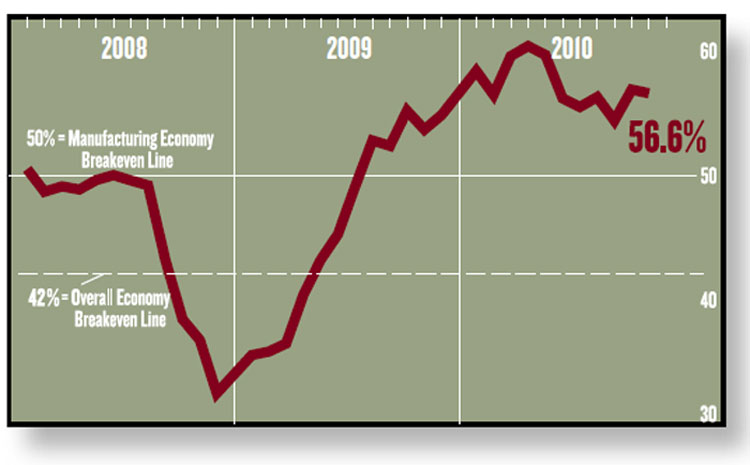
Source: Institute for Supply Management
But despite this good news, businesses remained very conservative in building inventories. As shown in the chart below, US companies viciously pared inventories in 2009, after the overall inventory to sales ratio had ballooned earlier in the year due to the rapid drop in sales.
Though overall inventories rose a bit early in 2010, resulting from a short spurt of inventory build after the dramatic draw down of 2009 (a move that was key to the 3.7% first quarter GDP growth), companies went conservative again for most of the rest of the year, though with a positive if mild upward trend as we ended 2010.
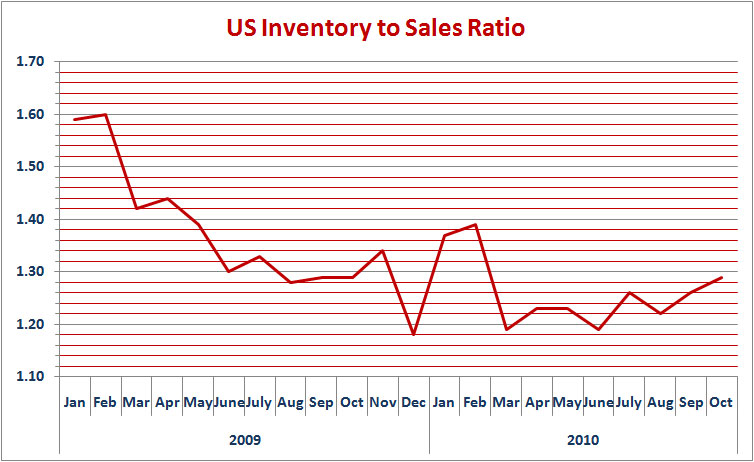
Source: Department of Commerce/Supply Chain Digest
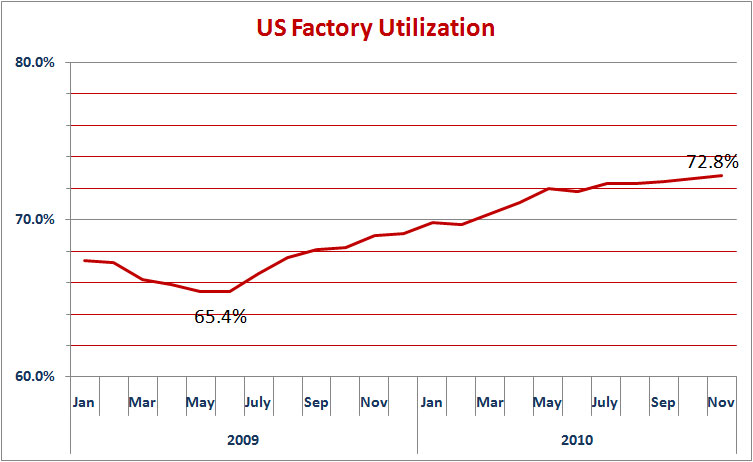
Factory utilization in the US continued its slow ascent from numbers again not seen since the Great Depression. As shown in the chart below, factory utilization hit bottom in June of 2009, at just 65%, and has risen steadily since, to almost 73% in November (though the rate of growth was very slow in 2010).
Trends Story Continues Below
|