The Council of Supply Chain Management Professionals (CSCMP) and partners Kearney and Penske Logistics are out this week with the 2020 State of Logistics Report, looking at 2019 data.
It is a mammoth effort, and one which takes six months from the end of the preceding year to produce the report in late June. The result of that time lag, seemingly unavoidable, is that the review of what happened in the previous year halfway through the current one makes the data modestly stale.
Gilmore Says.... |
 |
Since 2010, US logistics costs have ranged between 7.3% and 7.9% of GDP, rather remarkable stability.
|
 |
What do you say? |
|
| Click here to send us your comments |
| |
|
|
|
But this year that impact is especially great given we started the year without the coronavirus and then have endured months of it right through the current time.
I will note the report does a good in the commentary dealing with the virus impact in 2020 and beyond. It appropriately is sub-titled "Resilience Tested."
That said, the headline news: what the report several years back started calling US Business Logistics Costs (USBLC) barely rose on an absolute basis, up just 0.6% to $1.63 trillion, after a much larger run up in 2018.
With a faster rise in US GDP than logistics cost last year, that took the relative cost of logistics as a share of GDP to 7.6%, down from 7.9% in 2018.
As shown in the graphic below, that returned logistics costs as a share of GDP a little more in range with what we have seen in recent years, with 2018 being an exception after a sharp rise in trucking costs.
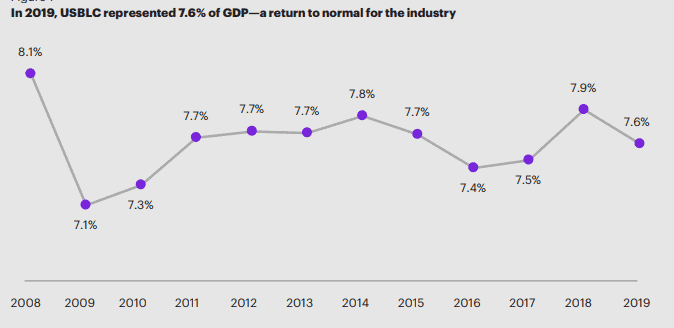
Since 2010, US logistics costs have ranged between 7.3% and 7.9% of GDP, rather remarkable stability.
The interesting thing to me: does it also indicate we are not seeing much progress in driving logistics costs down? That's a complicated question. Some note for example, that being stable despite the high per unit costs of rapidly growing ecommerce logistics is actually indicative of overall progress.
To get to this key number, you take the number for US logistics costs - from trucking to pipelines - and divide it by annual nominal (not real) GDP numbers. Voila, logistics costs as a percent of GDP emerges. The methodology must use nominal not real GDP as the denominator because the costs for the year are compiled in nominal terms.
The peak in the past dozen years was 2007 (not on chart), when logistics costs hit 8.59% of GDP, close to where it was in 2008 (8.5%) before taking a steep drop in the recession year of 2009 to 7.4%.
This is now the fifth report produced by consulting firm Kearney. Six Kearney consultants are cited as the report's authors, but a number of contributors from industry are also called out, too many to list here.
This is actually the 31th edition of the State of Logistics report, which was launched in 1988 by the late Bob Delaney and sponsored by his company, Cass Information Systems. Somewhere along the way, CSCMP took over the sponsorship.
Again this year, Penske Logistics funded the report development. For many years, the results were released at a major media event at the National Press Club in Washington DC. Not so with the virus among us this year. Instead, a web event launched the report on Tuesday.
Kearney says the average annual growth in logistics costs - again including inflation - is 3.5% over the past five years, versus by my calculation 4.1% for nominal GDP.
Underneath the overall logistics cost number, transportation costs - the largest single component of USBLC at 65% of the total - was up 2.5% in 2019, way down from the 10.4% increase in 2018.
The second component, inventory carrying costs (27.8% of the total), was down 4.6% last year under the report's calculation, which includes the cost of warehousing and inventory levels but also the cost of capital (which drives the cost of holding inventory). The drop in carrying costs was driven primarily by the fall in the average cost of capital to 5.9% last year versus 7.0% in 2018.
"Other" costs - always somewhat vague and mostly related to certain IT expenses and some services such as freight forwarding - were up 5.0%, though this is by far the smallest of the three main categories at just 7.1% of the total number.
You can find the full breakdown by logistics cost bucket in the chart below:
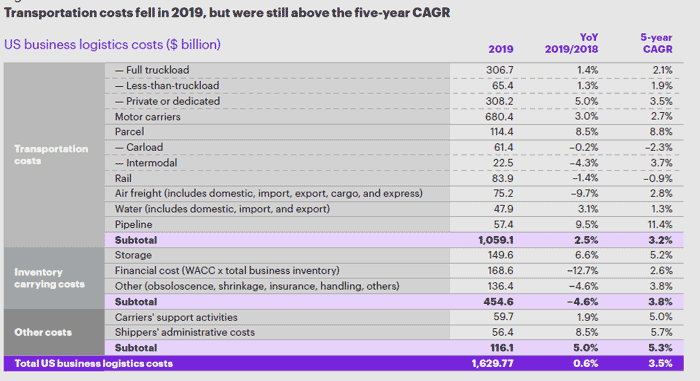
Within transportation, trucking-related spend (including private fleets but excluding parcel) comprise 64.2% of total transport costs and 41.7% of total logistics spend.
Parcel shipping costs were estimated at $114.4 billion, up a strong 8.5% over 2018. That represented 10.8% of transport costs and 7.9% of total logistics spend. Those two percentages are both not surprisingly up from 2018 levels. For example, parcel was just 6.4% of total logistics spend in 2018.
At $83.9 billion in 2109, rail comprised 7.9% of transportation spend - way down from 8.5% last year. Rail was also 5.1% of the total logistics costs, the same as last year.
But the US spent about $30.5 billion more in parcel shipping than it did in rail transport last year - way up from a delta of $16 billion in 2018.
In terms of growth in spending by these various categories, the 5-year average annual growth rate in costs by mode or cost category are as follows, according to the report:
• Truckload: 2.1%
• LTL: 1.9%
• Private/dedicated fleet: 3.5%
• Trucking combined: 2.7%
• Parcel: 8.8%
• Rail: -0.9%
• Air freight: 2.8%
• Waterways: 1.2%
• Warehousing: 5.2%
There are some significant changes in many of these CAGR numbers from the 2019 report, and I am not sure what caused these changes in just one year.
With overall logistics costs rising 3.5% per year over the past five years, comparing the rise in any specific areas versus that 3.5% overall number will indicate whether a category gaining or losing share of total spend (not the same as tonnage changes).
Trucking, for example, is still gaining in share of spend versus rail, while truckload and parcel are gaining share versus LTL.
The report has a lot more detail on each mode and cost bucket, as well as on the overall economic and logistics environment, which I don't have room for here.
The report also includes special sections inside the report on in third-party logistics, the potential impact of 5G wireless technology, and technology in supply chain generally.
As on-line supplements to the official report, the authors also look at retail and automotive supply chains trends.
I will have highlights from those special sections in this column soon.
My bottom line view: Kearney and CSCMP continue to improve this report, and it is well worth a read. This is the best job yet by far the report has done in integrating current trends and numbers with last year's numbers that are the heart of the report.
CSCMP members can already download a copy for no charge, and others purchase one for a modest fee. I recommend it.
Any reaction to our summary of this year's State of Logistics? How could the report be improved? Let us know your thought at the Feedback section below.
Your Comments/Feedback
|