2020 Supply Chain in Numbers and Charts
With about 9 days still left in January, I am wrapping up our review of the supply chain in 2020, this week we offer our popular look at the past year in numbers and charts.
Two weeks ago, I summarized what I thought were the key supply chain themes and trends of 2020 (see Review of the Year in Supply Chain 2020). Then last week I posted the top stories in each month in 2020 (see Top Supply Chain News by Month in 2020.)
So, let's get right to it the numbers and charts.
| GILMORE SAYS: |
Next week, we close out our 2020 review with a look at the year in numbers and charts.
WHAT DO YOU SAY?
Send us your
Feedback here
|
We always do a check on the US and global economy, as that has such an impact in the end on supply chain practice. And 2020 was an extreme roller coaster, to say the least.
Q1 of course includes March, when the virus outbreak began in the US. That led to a decline in GDP that - under normal times - would seem a severe contraction of 5.0%. Then came Q2, which made Q1 look like a piker, with GDP dropping a whopping and by far record 31.4%. Then came a snapback of 33.4% growth in Q3 - but from depressed Q2 levels.
It seems certan full year GDP will be negative, probably far exceeding the 2% decline in the deep recession year of 2009 and maybe worst since the Great Depression.
Amazingly, the US has not been reached 3% GDP growth since 2005, continuing a record span in failing to reach that mark, which used to be commonlace.
Meanwhile, after taking something of a pandemic hit early on, China says its GDP rose 2.3% for 2020 - making it the only large economy to see growth for the year.
The International Monetary Fund expects the global economy to grow 5.2% in 2021, after falling 4.4% in 2020, though it is updating its forecast on Jan. 26.
In the US, the IMF economists foresee 2020 growth of 3.1%.
The WTO estimates global trade volumes fell a large 9% in 2020, but are expected to rise 7.2% this year. However, growth in trade levels have simply never recovered from the Great Recession.
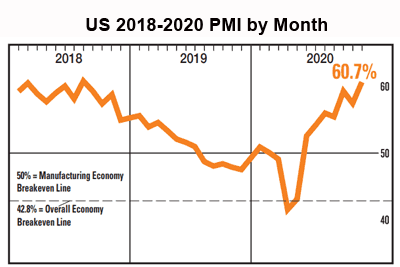
Not surprisingly, the US Purchasing Managers Index from the Institute of Supply Management, which tracks US manufactauring growth, went on a wild ride in 2020. The index, for which a score over 50 indicates US manufacturing expansion and under 50 contaction, briefly reverse a long mostly down trend, with a index level of 50.9 in January. But the number went back down bit in February, then fell sharply in the pandemic, reaching a signficant low of just 41.5 in April.
The scores the last few months have been strong, reaching a very good 60.7 in December, as seen in the chart below. However, that does not mean US manufacturing output was greater than in February, when the score was 50.1 - it wasn't. What it means is that a higher percentage of manufacturers say they saw growth last month than they did in February.

Another view of US manufacturing strength is the monthly index on output for US factories from the Federal Reserve.
That index started the year at a level of 104.9 in January, versus the baseline year of 2012 (index = 100).
The measure fell sharply with the pandemic, reaching a low of just 83.3 in April, then gradually improving to reach 102.2 in December.
And at a December index level of 102.2, it means US manufacturing output is just 2.2% above the baseline year of 2012, now nine years later, meaning almost no annual growth since then.
What's more, that also means current output still remains well below the peak year of 2007, when the index reached an historic high of 110.0 in December. US factory utilization fell sharply in April and May but has recovered to 73.4% in December, but well below the average of 78.2% between 1972 and 2019.
What is clear is that the stories on manufacturing coming back to the US are anecdotal at best, and that the trend is just not showing up in the numbers.
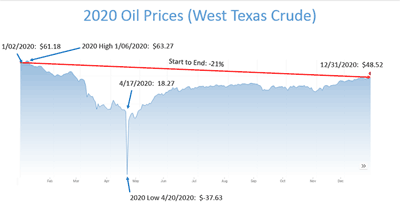
Looking at oil, the price for WTI crude started 2020 at $61.18 per barrel reached a high for the year a few days later, then went in to a strong decline spanning several months, before bizzarely falling into negative territory in April.
What does that mean? For a few days, demand fell so sharply, especially among refiners, such that combined with an extreme lack of storage space an oil owner had to pay someone to take the ocrude off their hands. Prices ended the year at $48.53, down 21% from the start.

Non-contractual diesel prices started the year at $3.07/gallon, then headed steadily down to a low of $2.37 in November before ending the year at $2.63.
Freight volumes were mixed, with ATA freight tonnage index down 3.3% in 2020, but ending on a modest strong note, up 2.3% year-over-year. That also put US freight volumes back to near pre-pandemic levels. It also marked the 11th consecutive year of annual tonnage gains.
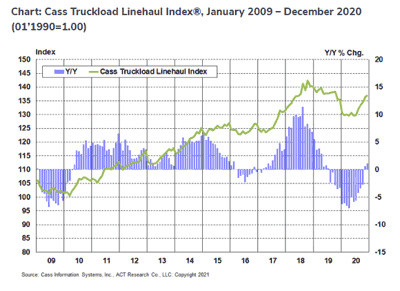
Even before the pandemic, the Cass Linehaul Index, which tracks US truckload rates, was on a downward trend that started in 2019. As seen in the graphic below, rates were down year-over-year for 15 straights months before barely turning positive in November and December. For many months in Q1 and Q2, the decline in rates was a steep 6-9%.

It was another tough year for US railroads. Total US rail traffic for 2020 was down 7.2%, and the once fast growing intermodal traffic component was down 1.8%, but that was better than 2019.
In terms of ocean container carriers, volumes and rates fell sharply for awhile early in the pandemic. Then carriers started cancelling sailings to reduce capacity - and rates jumped. They kept going up for the rest of the year, driven by a return of volumes and a lack of containers.
The China Containerized Freight Index ended the year at about 1625, up from just 750 at the start of the year. That means rates more than doubled, with reports Chinese officials were bringing carriers in and warning them to put a lid on further rate hikes, concerned the costs would dampen export volumes.
In the end, the US tariiffs clearly had little impact on the US trade deficit. Imports from China were down from 2019, but so were US exports to China, and the decline in imports was more driven by a pandemic-related decline in the overall economy than tarifffs. Chinese imports were back to near record levels of about $45 billion in October and November, the last month for which data is available, versus just $14 billion or so in US exports to China. The full year trade deficit with China will be about $320 billion, down not much from $435 billion in 2019 despite the weak economy.
The growth of ecommerce sales in the US went bananas. Growth in Q1 was up about the usual level, a robust 14.8% - but that looks wimpy now. On-line sales were up an incredible 44.5% in Q2, and 36.7% in Q3.
I have lots more but am out of space. Hope you enjoyed all this.
What is your reaction to the supply chain 2020 in numbers and charts? What would you add? Let us know your thought at the Feedback section below.
|


