This week in SCDigest:
Insights from the Supply Chain Assessment Database
Supply Chain Graphic of the Week and Supply Chain by the Numbers
New Cartoon Caption Contest Begins This Week!
SC Digest On-Target e-Magazine
This Week In "Distribution Digest"
  Trivia Feedback
Become a Sponsor
Subscribe
SCDigest Home Page
  Newsletter Archives                  Can't View In E-mail? June 9, 2011 - Supply Chain Newsletter


Featured Sponsor: CDC Software


Learn how Stryker Osteosynthesis, a Medical Device
Manufacturer of Lifesaving Equipment, Achieved Alignment of
Supply to Demand and Built a World-Class Inbound Supply Chain.


WEDNESDAY'S VIDEOCAST

WESCO Drives Continuous Distribution Center (DC) Improvement with Hands-Free Wearable Terminals

From Traditional Handheld and Truck-Mount Radio Frequency (RF) Terminals to a New Generation of "Wearable" Mobile Wireless Devices

Featuring Larry Mosier, VP of Distribution Centers & Transportation at WESCO, Mike Rusnak, Distribution Center Manager at WESCO, Mark Wheeler, Director of Supply Chain Solutions at Motorola Solutions


Wednesday, June 15, 2011


UPCOMING VIDEOCAST

Goya Transforms its Supply Chain to Enhance Profitable Growth and Service

Learn How Goya Grew from a Small Store-Front Business into The Largest Hispanic-Owned Food and Number-One Latin Brand Company in the United States

Featuring Peter Unanue, Executive Vice President, Goya Foods, Inc, Danny Halim, Vice President, Industry Strategy, JDA Software


Tuesday, June 28, 2011


UPCOMING VIDEOCAST

Building a Better S&OP Plan

New Optimization Techniques Deliver
an Adaptive Supply Chain for
Global Automotive Manufacturers

Featuring Dr. Claude Fornarino, Director, Industry Solutions, IBM ILOG Optimization & Analytical Decision Support Solutions


Wednesday, June 29, 2011


NEWS BITES
This Week's Supply Chain News Bites
Supply Chain Graphic of the Week: Shrinking Gap Between US and China Manufacturing Costs

This Week's Supply Chain by the Numbers for June 9, 2011:

  • Truckload Capacity Getting Real Tight;
  • China's Shrinking Labor Cost Advantage;
  • Railcar Idling Turns Other Direction;
  • Nestle Sees Unprecedented Commodity Price Volatility
AUTOMOTIVE CASE STUDY FROM CDC SOFTWARE

Achieve Customer, Supplier

& Inventory Alignment

Learn how Tier One Automotive Achieved Customer, Supplier & Inventory Alignment for their Global Parts Operations Center while reducing inventory by 25%!


NEW CARTOON CAPTION CONTEST

BEGINS THIS WEEK!

June 6, 2011 Contest


See The Full-Sized Cartoon and

Send In Your Entry Today !

ONTARGET e-MAGAZINE


Weekly On-Target Newsletter
June 8, 2010 Edition

New Cartoon, State of Freight Q2, US Manufacturing Renaissance? and more


THIS WEEK ON DISTRIBUTION DIGEST
Holste's Blog: The Escalating Cost of Expedited Services

Top Story: Interest in Crossdocking is High, but Challenges are Many
Top Story: Annual WERC DC Metrics Study Finders Leaders Extending their Lead
Top Story: WERC 2011 Video Review and Comment
 

SUPPLY CHAIN TRIVIA
Q: Match the wireless/RF system providers that were acquired from the mid-1990s through the mid-2000s to the companies which acquired them: Acquired: Norand, Telxon, Hand Held Products; Teklogix; Acquirers: Symbol Technologies (now Motorola); Psion; Honeywell; Intermec.
A: Found at the Bottom of the Page

Insights from the Supply Chain Assessment Database

We received a ton of great formal and informal feedback on our piece last week on A Little Supply Chain Finance 101. "Give us more stuff like this" was a common theme. We will do our best to oblige.

It has been hectic around here as always - we have several new innovations on the way soon about which we are very excited.

GILMORE SAYS:

"This means to us that clearly there is a huge supply chain performance and capability gap between companies in a given sector, many of which will in fact be direct competitors."

WHAT DO YOU SAY?

Send us your
feedback here

We received a ton of great formal and informal feedback on our piece last week on A Little Supply Chain Finance 101. "Give us more stuff like this" was a common theme. We will do our best to oblige.

It has been hectic around here as always - we have several new innovations on the way soon about which we are very excited.

Given all that, I am going to take it a little easy today and just report on the highlights from a recent study our research arm CSCO Insights recently performed relative to overall supply chain performance.

As you may have seen, our "Cool New Product of the Month" for January was a new supply chain self-assessment tool from JDA Software. I liked it for several reason, especially the automated way that gave respondents some very good insights for relatively little effort. The on-line tool in part took the intelligence of the traditional strategic value assessment process used by i2 Technologies (which JDA acquired last year) and automated it. You obviously can't get the full type of insight you can with an on-site assessment, but this is not at all a bad place to start.

While the assessment is obviously oriented at providing benchmark data and insight for individual companies, we came up with the bright idea that general insight might be gained from analyzing the responses in aggregate, which is what we did across the nearly 100 respondents at the time we did the analysis (there are well over 100 now I believe). The data and commentary are available in the full report (see Insights from the JDA Supply Chain Assessment Tool 2011), but I will pick a few examples to highlight here.

The companies participating represented a wide array of both size and industries, tilting a bit perhaps towards larger companies, but with nearly every industry sector represented with at least a few respondents.

The survey is oriented towards levels of "maturity" across specific processes in demand management, supply management, inventory management, etc. , for most questions giving companies one of five choices in terms of current practice, moving from least mature to most mature or world class. In the report, we analyzed one or two of the responses from each main section, a few of which are published below.

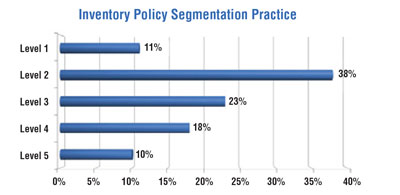
Let's start with a question about the level of process maturity for "Inventory Policy Segmentation." As stated, there were five levels:

Level 1: All parts or items treated the same
Level 2: Simple ABC segmentation-based on one dimension like usage or value
Level 3: Multi-dimension segmentation (many dimensions, more than just usage and value)
Level 4: Multi-dimension across the whole enterprise reviewed/updated at least once a year
Level 5: Multi-dimension within each business unit reviewed/updated at least once a year

As shown in the graphic below, just 11% of respondents said they treated all SKUs the same. But we were not surprised that a large number of companies (38%) at level 2, were using basic ABC type SKU segmentation based just on volume or value.


See Full Size Image Here


Indeed, the fact that 51% of respondents were using multiple attributes and/or reviewing these segmentation frameworks annually at different levels of the company shows just how far many companies have taken the practice of inventory management. This is perhaps the result of the increased emphasis inventory management has received during and after the economic downturn of 2008-09.

Under the supply management category, we chose a question related to how well final production schedules actually “comply” with published production and procurement plans.

Here, the levels were:

Level 1: More than 20% of the plan is overridden (actual vs. plan variance)
Level 2: Between 10% and 20% of the plan is overridden but overrides are tracked
Level 3: Between 5% and 10% of the plan is overridden but overrides are tracked
Level 4: Less than 5% of the plan is overridden
Level 5: Less than 1% of the plan is overridden

As shown in the chart below, the obvious observation for this question is that just 1% of respondents (one company, actually) had reached the highest level of maturity, in which less than 1% of the plan is overridden - quite a level of production performance.


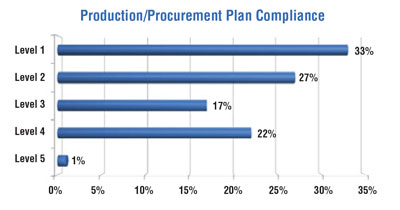
See Full Size Image Here


In fact, different from any other question in the assessment, more companies (33%) chose level 1, in which more than 20% of the plan is overridden on average. The second most common response, at 27%, was at level 2, where 10-20% of the plan is overridden.

As challenging as reaching level 5 may seem, best-in-class companies are in fact able to re-run supply plans daily across their global supply chain and keep to those plans with something like just 1% in overrides.

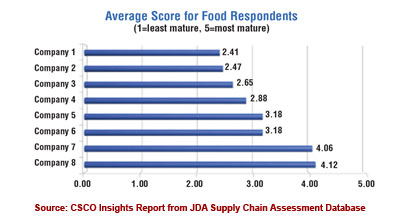
Finally, what I thought was the most important chart was one that showed differing levels of performance within an industry sector. For this exercise, we converted all the answers to a numeric scale, with 1 being the least mature, 5 the most, etc. We then tallied up the scores and divided by the number of questions to get an overall average for the entire assessment.

In the report, we highlighted relative performance among the eight respondents that at the time had come from the food manufacturing industry. This is really what is at the heart of the assessment process. As shown in the chart below, we see that the companies rate from a low average score of just 2.41 all the way to two of the few firms that had average scores over 4.0, with everyone else in between.

See Full Size Image Here


This means to us that clearly there is a huge supply chain performance and capability gap between companies in a given sector, many of which will in fact be direct competitors. That is true not only on a qualitative/maturity level, but also of course in how those differences translate in most cases directly to financial performance in terms of cost, revenue and profit.

A couple of overall observations include:

  • The spread between the lowest and highest levels of maturity in each area is very broad
  • Just a few companies are well above average in most areas; most have pockets of strength and relative weakness
  • Companies tended to be more mature in areas that directly impacted the customer, such as order fulfillment to promise date.

There are many more charts and other overall observations in the full report. Think you will enjoy it.


Any reaction to these benchmark numbers? Let us know your thoughts at the Feedback button below.


Dan Gilmore


Send an Email


View Web/Printable Version of this Page


YOUR FEEDBACK

A mishmash of feedback link, a few on Gilmore's Blog wondering if global supply chains would need to start ordering Geiger counters to protect again irradiated product coming from Japan, some on the Lessons from Dell's Supply Chain Transformation, and one on McKinsey's view of the future supply chain.

Most short and suite - you will find them all below.


Feedback on Geiger Counters for the Supply Chain:


Given our sensitivity to radiation, I would not be surprised that any thing from Japan will be view as suspect for the time being and until the facility over there is "capped". Americans have a great underlying fear of radiation and are quick to avoid it where ever possible. Even to the point of having their granite counter tops tested and removed if there is any sign of radiation. While this fear is present, it is poorly understood and "even made fun of" with a great risk to anyone who tries to sell any thing that could be contaminated.

No on really knows what a safe amount of radiation is and this is the basis of much of this fear. While there is radiation all around us all of the time that we are totally unaware of, once we have a heightened awareness, it does not subside for quite a long time. It would behoove those importing items from Japan to demonstrate a before and after reading of radiation if they can to prove to their customers that it is not an issue.

Ralph Salier-Hellendag
ONEOXY Services Team


Like it or not, this threat is real.

Special customs processes should be initiated for all cartons, boxes, inner packs, and items coming from Japan.

Are there any plans? I don't think I would be musing over this during dinner, ( and as you know, I regard myself as a fun guy).


Mark Shuda


On Dell's Supply Chain Transformationi:


Supply chain segmentation. It's clear that one size doesn't fit all, and at the same time decissions have to be taken in order to not fully segment the whole supply chain. Therefore a unite view on non-core supply chain attributes has to be implemented at the same time of a segmentation exercise, in order to design a effective (segmented) and efficient supply chain.

Although Simchi-Levi methodology can be easier to understand as it is related to real cases (Inditex, Wal-Mart, Dell....) I believe Dr. John Gattorna approach on Supply Chain Segmentation is a more complete approach, with very deep roots on human behaviour (the most important element in any organisation) thefore in my point of view, a conceptually stronger and more feasible to implement in any business environment methodology.

Xavier Farrés
International Supply Chain Consultant


Great summary of Dell's supply chain management breakthroughs. I am sending you a copy of my book "Supply Chain Management: The Real WOW Factor", just published after 32 years with P&G. The book details P&G's consumer-driven supply network, shelf-back supply chain design by customer segment, price-back costing, and customer-centric supply chains. Great to see that Dell is walking the talk.

There is also a part in the book on SCM in developing markets which is getting great reviews.

William D. Peace Jr.


Actually, it was impressive for me to hear about Dell’s transformation in relatively short period of time. I’m a student at Illinois Tech and one of my assignments was on Dell’s supply chain and after watching the video and reading the articles I came to the following question: since Dell segments its supply chain based on customer’s demands, what is it going to do when these demands change, like they did before. How are they planning on moving in sync with the customer? It is a very good but risky strategy, from my point of view, but I am with Dell on this issue.

Vadim Vorobyov


On McKinsey's SKU Segmentatiion Graphic:


A company's competitive strategy differs depending on where it is situated. Multi-nationals (MNCs) with operations in Asia typically compete on cost and hence strive towards operational excellence. With the luxury of simply relocating to a cheaper location (as in the case of Motorola in Singapore and Malaysia), it only shows that cost is still a major contributory factor to strategic decisions. Having said that, we are beginning to see SMEs accept a higher cost model in preparation for their changing consumer landscape. SMEs realise that their competitive edge differs from that of larger companies and are capitalising on this fact through the movement on the mechanisation/systemisation matrix.


KOH Niak Wu, Ph.D.

Singapore Institute of Manufacturing Technology


SUPPLY CHAIN TRIVIA
Q: Match the wireless/RF system providers that were acquired from the mid-1990s through the mid-2000s to the companies which acquired them: Acquired: Norand, Telxon, Hand Held Products; Teklogix; Acquirers: Symbol Technologies (now Motorola); Psion; Honeywell; Intermec.
A: Norand/Intermec; Telxon/Symbol (Motorola); Teklogix/Psion; Hand Held Products/Honeywell.
Copyrights © SupplyChainDigestTM 2003-2010. All Rights Reserved.
SupplyChainDigest
PO Box 714
Springboro, Ohio 45066

POWERED BY: XDIMENSION