u
Search By Topic The Green Supply Chain Distribution Digest
Supply Chain Digest Logo

Supply Chain News Bites

Supply Chain Graphic of the Week: Explaining the Current Supply Chain Mess in One Graphic


New York Times Provides Excellent Summary


Dec. 9, 2021


It has been a year in supply chain like no other: shortages of most everything; long shipping delays and soaring rates; more than 100 cargo ships waiting off of the ports of Los Angeles and Long Beach; soaring inflation and more.


But how on each did we get here? This week, the New YorK Time's web site published an excellent graphic that explains it all pretty darn well, as you can see below:
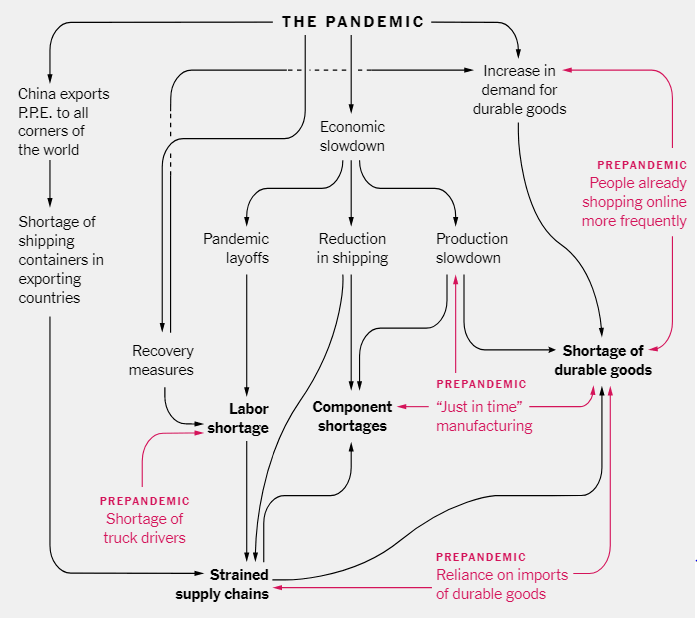


Source: New York Times


The actual NYT's web page annodates a build of the full graphic that is well worth a view. You can find it here: How the Supply Chain Crisis Unfolded


Any reaction to our Supply Chain Graphic of the Week? Let us know your thoughts at the Feedback button below.


Your Comments/Feedback


  .

Features

Resources

Follow Us

Supply Chain Digest news is available via RSS
RSS facebook twitter youtube
bloglines my yahoo
news gator

Newsletter

Subscribe to our insightful weekly newsletter. Get immediate access to premium contents. Its's easy and free
Enter your email below to subscribe:
submit
Join the thousands of supply chain, logistics, technology and marketing professionals who rely on Supply Chain Digest for the best in insight, news, tools, opinion, education and solution.
 
      
Home | Subscribe | Advertise | Contact Us | Sitemap | Privacy Policy
© Supply Chain Digest 2006-2023 - All rights reserved
.