After using this column to provide news and comment on the virus pandemic and the supply chain for almost three months, I am behind on my coverage of several major reports and other matters.
That would include my annual review of the excellent BP Statistical Review of World Energy, released by the company each year in late June. The review is a sort of almanac of all matter of energy related data, now in its 69th year, and as always it is quite an interesting and educational read.
The report is full of informtion on energy production and consumption. Energy of course is at the heart of supply chain in many ways, and central to our lives. A world of relatively cheap, abundant energy would bring prosperity and more income equality to much of the world.
Gilmore Says.... |
 |
| The disruption to our everyday lives caused by the lockdowns has provided a glimpse of a cleaner, lower carbon world. |
 |
What do you say? |
|
| Click here to send us your comments |
| |
|
|
|
High energy prices have the opposite effect, as we learned in the 1970s and again in 2008.
Energy costs can have a major impact on a variety of supply chain decisions, including network design and how to optimally navigate the tradeoff curve between inventory and transportation costs.
As with so many things, there is some disconnect here as the report is focused on data relative to 2019, while in 2020 energy and almost all markets have been greatly impacted by the virus pandemic. Next year's report summarizing 2020 data will show many changes from this year's report.
In an introduction to the report, BP CEO Bernard Looney notes that the pandemic also "risks slowing progress if the short-term, domestic issues raised by COVID-19 are prioritized over long-term, global challenges, such as climate change."
It is of course interesting that the CEO of an oil company is lamenting the lack of progress in CO2.
The headline news from the report is that primary energy consumption growth slowed to 1.3% last year, less than half the rate of growth in 2018 (2.8%). That decline in large part is attributable to a slowing global economy, not a true relative reduction in energy use.
The increase in energy consumption was driven by renewables and natural gas, which together contributed three quarters of the expansion. All fuels grew at a slower rate than their 10-year
averages, apart from nuclear.
The report says carbon emissions from energy use grew by 0.5%, less than half 10-year average growth of 1.1% per year, partially reversing some of the unusually strong increase in 2018 (2.1%)
It also means CO2 emissions grew at less than half the rate of energy consumption, primarily through the increase of consumption of lower CO2 energy sources. That said, the average annual growth in carbon emissions over 2018 and 2019 was greater than its 10-year average, BP says.
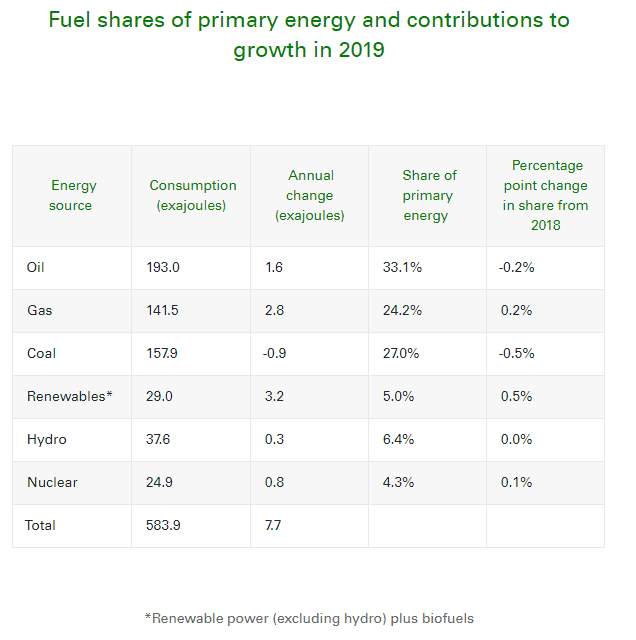
Switching gears, the chart below from the report nicely summarizes global energy consumption in 2019 by different fuel types and changes from 2018.

As can be seen, incremental change is low. Oil's share of energy consumption fell again, but just barely, down 0.2%, and it retains the top spot with 33% share. Coal's share fell a more substantial 0.5%, but stll generates nearly one quarter of energy consumption.
Renewable consumption grew by 0.5%, and reached 5% share of consumption for the first time.
Other interesting data points from the report include the following:
• By country, China was by far the biggest driver of energy growth, accounting for more than three quarters of net global growth in consumption. India and Indonesia were the next largest contributors to growth, while the US and Germany posted the largest declines.
 • China also drove almost all the increase in oil consumption (up 0.9% globally, slightly lower than the 10-year average of 1.3%). China oil demand rose by 680,000 barrels per day, the largest increase in the country's demand since 2015. • China also drove almost all the increase in oil consumption (up 0.9% globally, slightly lower than the 10-year average of 1.3%). China oil demand rose by 680,000 barrels per day, the largest increase in the country's demand since 2015.
• The US posted the largest increase in oil production of any country in for the third consecutive year, with its output rising by a massive 1.7 million barrels per day, although this was down from a record increase in 2018 (2.2 million barrels per day).
• Oil prices edged a little lower in 2019, with Brent crude averaging $64.21 per barrel, compared with $71.31in 2018.
• The share of renewables varies greatly by country/region. Renewables produced 6.2% of US energy in 2019, the report says, up from 5.8% in 2018. In the EU, renewables have a much larger 11% share, versus 4.7% from China. In Brazil, it's 16.3%.
• By energy source, wind generation provided the largest contribution to growth in renewables, followed closely by solar.
• Nuclear generation increased by 3.2%, its fastest growth since 2004 and well above the 10-year average of -0.7%. China and Japan drove the rise.
As a final note, BP CEO Looney observed that "The disruption to our everyday lives caused by the lockdowns has provided a glimpse of a cleaner, lower carbon world: air quality in many of
the world's most polluted cities has improved; skies have become clearer."
The full BP report is available here: Statistical Review of World Energy 2020
Any reaction to the BP report data? Let us know your thought at the Feedback section below.
Your Comments/Feedback
|