![]() |
| |
![]() |
 |
![]() |
 |
|
| |
|
|
| |
 |
|
| |
|
|
| |
 Supply Chain Trends and Issues: Our Weekly Feature Article on Important Trends and Developments in Supply Chain Strategy, Research, Best Practices, Technology and Other Supply Chain and Logistics Issues Supply Chain Trends and Issues: Our Weekly Feature Article on Important Trends and Developments in Supply Chain Strategy, Research, Best Practices, Technology and Other Supply Chain and Logistics Issues |
|
| |
|
|
| |
|
 |
|
| |
|
|
| |
|
|
| |
by SCDigest Editorial Staff |
|
| |
|
|
| |
The annual lists of the largest global and US 3PLs have once again been released by the analysts at Armstrong & Associates, and as usual European and Asian providers dominate the 10 rankings worldwide, based on 2012 revenues.
SCDigest Says: |
 Domestic transportation management saw revenues of $6.6 billion, or just 10% of the total US spend on 3PLs, but the sector saw net profit margins of an amazing 20.3%. Domestic transportation management saw revenues of $6.6 billion, or just 10% of the total US spend on 3PLs, but the sector saw net profit margins of an amazing 20.3%.

Click Here to See Reader Feedback
|
In that list, led by DHL Supply Chain & Global Forwarding with revenues of almost $32 billion, just two US-based companies cracked the top 10. Those were CH Robinson, with sales of $11.3 billion, and UPS Supply Chain Solutions, with revenue of just over $9 billion.
All told, revenues for US 3PLs (including the US operations of 3PLs headquartered in other regions) increased by 6% on a gross basis to $141.8 billion. That "gross number" includes the cost of purchased transportation. On a net basis, with purchases transportation costs deducted out, total US 3PL revenues rose by 4.1%.
That means growth in 3PL spend last year was about flat with overall economic growth. While "real GDP" rose only 1.8% in the US last year, the right comparison to 3PL spend is GDP growth in current dollars, not indexed for inflation, since the Armstrong numbers are not indexed.
So, net US 3PL revenues rose 4.1% in 2012, while US nominal (non-inflation adjusted) GDP rose 4%, implying that 3PLs share of total logistics spend was about flat - quite a change from most years in the last couple of decades.
That flat spend drove the compound annual growth rate (CAGR) of US 3PL revenues from 1996 to 2012 down 0.3% percentage points, to 10%. In 2011, gross US 3PL revenues rose about 5%, meaning the growth of 3PL market share seems to have stalled recently, based on 2011-12 data.
Shipper Spend by Service Area
The spend and 3PL profitability by service area is very enlightening.
"Value added warehouse and distribution" (VAWD) was by far the largest 3PL service area, with net revenues of $27.6 billion that comprised 43% of total net US spend of $63.5 billion.
Top 50 Largest Global 3PLs by 2012 Gross Revenues
| Rank |
Third-Party Logistics Provider |
2012 Revenue |
| 1 |
DHL Supply Chain & Global Forwarding |
$31,639 |
| 2 |
Kuehne + Nagel |
$22,141 |
| 3 |
Nippon Express |
$20,321 |
| 4 |
DB Schenker Logistics |
$19,789 |
| 5 |
C.H. Robinson Worldwide |
$11,359 |
| 6 |
Hyundai GLOVIS |
$9,832 |
| 7 |
CEVA Logistics |
$9,290 |
| 8 |
UPS Supply Chain Solutions |
$9,147 |
| 9 |
DSV |
$7,759 |
| 10 |
Sinotrans |
$7,523 |
| 11 |
Panalpina |
$7,060 |
| 12 |
SDV (Bolloré Group) |
$7,038 |
| 13 |
Toll Holdings |
$6,760 |
| 14 |
Expeditors International of Washington |
$5,981 |
| 15 |
Geodis |
$5,868 |
| 16 |
DACHSER |
$5,670 |
| 17 |
GEFCO |
$5,267 |
| 18 |
UTi Worldwide |
$4,608 |
| 19 |
Agility |
$4,605 |
| 20 |
IMPERIAL Logistics |
$3,800 |
| 21 |
Hellmann Worldwide Logistics |
$3,593 |
| 22 |
Yusen Logistics |
$526 |
| 23 |
Damco |
$3,727 |
| 24 |
Kintetsu World Express |
$3,155 |
| 25 |
Hub Group |
$3,124 |
| 26 |
Burris Logistics |
$2,933 |
| 27 |
Schneider Logistics & Dedicated |
$2,700 |
| 28 |
Sankyu |
$2,689 |
| 29 |
Pantos Logistics |
$2,601 |
| 30 |
Kerry Logistics |
$2,490 |
| 31 |
Norbert Dentressangle |
$2,366 |
| 32 |
Ryder Supply Chain Solutions |
$2,280 |
| 33 |
FIEGE Group |
$2,090 |
| 34 |
BDP International |
$1,895 |
| 35 |
Wincanton |
$1,747 |
| 36 |
Neovia Logistics Services |
$1,730 |
| 37 |
Menlo Worldwide Logistics |
$1,726 |
| 38 |
Logwin |
$1,703 |
| 39 |
Nissin Corporation/Nissin Group |
$1,609 |
| 40 |
Americold |
$1,580 |
| 41 |
APL Logistics |
$1,555 |
| 42 |
BLG Logistics Group |
$1,540 |
| 43 |
J.B. Hunt Dedicated Contract Services & Integrated Capacity Solutions |
$1,536 |
| 44 |
GENCO |
$1,476 |
| 45 |
Total Quality Logistics |
$1,387 |
| 46 |
Landstar |
$1,350 |
| 47 |
Transplace |
$1,300 |
| 48 |
OHL |
$1,200 |
| 49 |
Werner Enterprises Dedicated & Logistics |
$1,090 |
| 50 |
Swift Transportation |
$1,058 |
Source: Armstrong & Associates
The US-specific list is further down the page.
(Supply Chain Trends and Issues Article - Continued Below)
|
|
|
|
| |
|
CATEGORY SPONSOR: LONGBOW ADVANTAGE - JDA SUPPLY CHAIN CONSULTANTS |
| |
Download Longbow Advantage
Business Briefs
The Keys to WMS Success,
Maximizing JDA WMS
Performance and More

|
|
| |
|
|
|
|
But net profit margins for warehousing were just 2.9% at US 3PLs, as shown in the chart below. Conversely, domestic transportation management (DTM) saw revenues of $6.6 billion, or just 10% of the total US spend on 3PLs, but that service sector saw net profit margins of an amazing 20.3%, according to Armstrong.
US 3PL Revenue by Service Area 2012
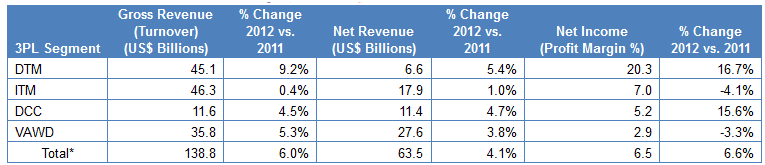
Source: Armstrong & Associates
That was far above the profit margins for international transportation management (ITM), at 7%, and dedicated contract carriage (DCC), at 5.2%.
For 2013, Armstrong again predicts gross US 3PL revenues will again rise about 6%, to $148.4 billion.
The list of the largest 3PL operations in the US are shown below.
Top 30 Largest US 3PL based on 2012 Revenues
| Rank |
Third-Party Logistics Provider |
2012 Revenue |
| 1 |
C.H. Robinson Worldwide |
$11,359 |
| 2 |
UPS Supply Chain Solutions |
$9,147 |
| 3 |
Expeditors International of Washington |
$5,981 |
| 4 |
Kuehne + Nagel (The Americas) |
$4,878 |
| 5 |
UTi Worldwide |
$4,608 |
| 6 |
Exel (DHL Supply Chain - Americas) |
$4,500 |
| 7 |
DB Schenker Logistics |
$4,034 |
| 8 |
Hub Group |
$3,124 |
| 9 |
Burris Logistics |
$2,933 |
| 10 |
CEVA Logistics (The Americas) |
$2,787 |
| 11 |
Schneider Logistics & Dedicated |
$2,700 |
| 12 |
Ryder Supply Chain Solutions |
$2,280 |
| 13 |
Panalpina (The Americas) |
$2,120 |
| 14 |
BDP International |
$1,895 |
| 15 |
Neovia Logistics Services |
$1,730 |
| 16 |
Menlo Worldwide Logistics |
$1,726 |
| 17 |
Americold |
$1,580 |
| 18 |
J.B. Hunt Dedicated Contract Services & Integrated Capacity Solutions |
$1,536 |
| 19 |
GENCO |
$1,476 |
| 20 |
Total Quality Logistics |
$1,387 |
| 21 |
Landstar |
$1,350 |
| 22 |
Transplace |
$1,300 |
| 23 |
OHL |
$1,200 |
| 24 |
Werner Enterprises Dedicated & Logistics |
$1,090 |
| 25 |
Swift Transportation |
$1,058 |
| 26 |
NFI |
$1,050 |
| 27 |
Greatwide Logistics Services |
$1,046 |
| 28 |
Universal Truckload Services |
$1,037 |
| 29 |
FedEx Trade Networks/FedEx Supply Chain Services |
$1,028 |
| 30 |
APL Logistics (The Americas) |
$1,025 |
Source: Armstrong & Associates
Anything in this Armstrong data surprise you? Let us know your thoughts at the Feedback section below.
SCDigest is Twittering!
Follow us now at https://twitter.com/scdigest |
| |
![]() ![]() |
|
|
|
Recent Feedback |
|
No Feedback on this article yet
|
|
|
| |
|
|
 |
![]() |
 |
|
| |
|
![]() |
|
|

