As usual, SCDigest has been doing some further analysis of the working capital data REL, a Hackett Group company, has made available to SCDigest for almost a decade now.
That includes this week's First Thoughts column by SCDigest editor Dan Gilmore, which looks at inventory turn performance in 2014 by various sectors (see Inventory Performance 2015 Part 2).
REL uses the three components of working capital - inventory, payables and receivables - to track changes over time in each area across 1000 large publicly traded companies, and then all three together to measure the "cash conversion cycle," a metric that expresses the length of time, in days, that it takes for a company to convert resource inputs into cash flows.
So, a lower CCC is better, as is lower DIO (Days Inventory Outstanding), which is sort of the opposite of inventory turns. From a company's own cash flow perspective, higher Days Payables Outstanding (DPO) is better, but of course that means a company is stretching out payables to suppliers even longer, which can have its own set of ramifications.
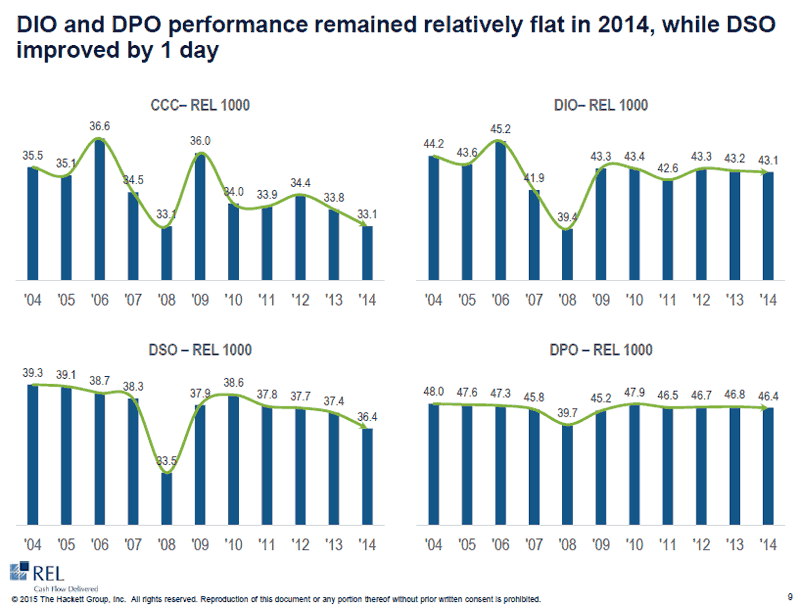
All of these measures were tracked in this year's REL report for the last 10 years, as shown in the graphic below:

So, overall cash conversion cycles are down about 7% from 2004. Inventory performance as measured by DIO has improved about 2.5% over the same period, though is basically flat with 2010. And despite all the articles about big companies stretching out payments to suppliers over the past few years, DPO levels have contracted since 2004 and 2010, meaning payments are actually being made slightly faster on average.
So there you have it - a bit more "supply chain finance 101," as we like to say.
Any Feedback on our Supply Chain Graphic of the Week? Let us know your thoughts at the Feedback section below. |