We have covered the innovative Risk Exposure Index (REI) from Dr. David Simchi-Levi of MIT over the past three years, most recently summarizing a Videocast on our Supply Chain Television Channel that told the story of how auto giant Ford is using this tool for risk management.
To learn more about the REI and Ford's story, go here: Supply Chain Risky Business 2015
Simchi-Levi recently published an article on Harvard Business Review on-line, where he takes another slant on the Ford story and explains two important REI concepts:
Time-to-Recovery: The time it would take for a particular node - a supplier facility, a
distribution center, or a transportation hub - to be restored to full
functionality after a disruption. Most companies of course have no idea what the TTR of nodes in their network are, as Toyota painfully learned after the 2011 Japanese earthquake/tsunami devestated its supply chain.
Time-to Survive: The maximum duration that the supply chain can match supply with demand
after a node disruption. To determine TTS associated with a specific
node, you remove the node from the supply chain and calculate how long, using inventory in the pipeline and other available supply sources, a company can serve customer demand without that node.
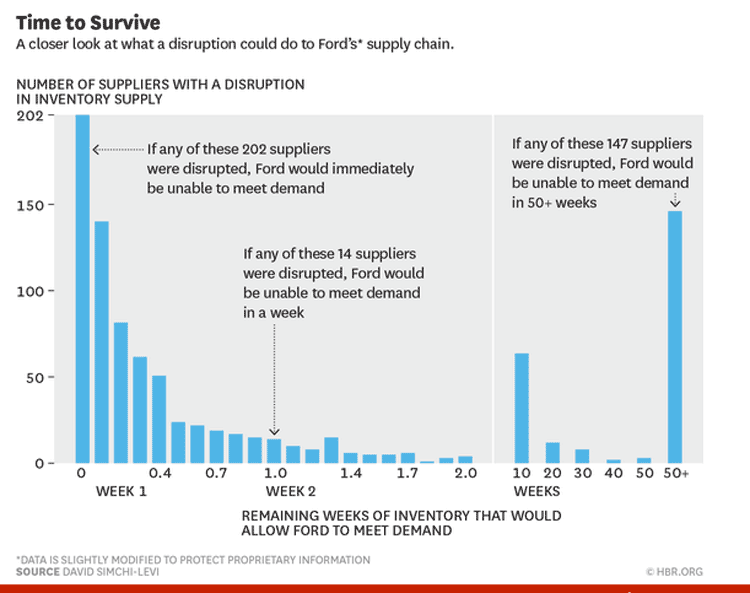
Cutting to the chase, Simchi-Levi provides a graph in that article showing an analysis of Ford's suplier network, using TTS, as shown below.

Source: David Simchi-Levi/Hardard Business Review
The graph plots the number of suppliers (Y-axis) along the legnth of the TTS (in days/weeks) for each grouping (X-axis).
As can be seen, Ford had hundreds of suppliers for which TTS was less than one week, meaning a supplier disruption would cause an almost immediate disruption to Ford's product supply capability. Clearly then, risk mitigation strategies are in order, whether that's bulking up a bit on inventory, dual sourcing, or other tactics.
On the other hand, there are suppliers on the far right of the graph that have TTS values in the tens of weeks - some as high as 50 weeks. For these companies, there may be opportunities to reduce inventories at Ford or the supplier to reduce costs.
Good work as usual by Simchi-Levi.
Any Feedback on our Supply Chain Graphic of the Week? Let us know your thoughts at the Feedback section below.
|