As can be seen, the number of thick red lines, especially it seems to us the number indicating a rise to 25,000 to 49,000 vehicles per day, jumps dramatically. Add in big growth in miles driven in automobiles, and the picture isn't good. The road and highway infrastructure is not even close to keeping pace with this growth - it is in fact struggling to maintain the staus quo.
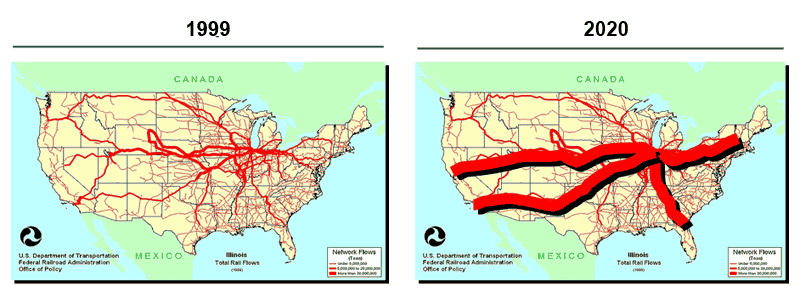
Basically a similar story for rail can be seen, as shown in the graphic below:
Actual and Projected Railcar Traffic 1999 versus 2020

It's hard to see the legends on these charts, but suffice it to say the projected growth will be in the millions of carloads annually, and while rail carrriers are in fact spending a lot of money (about 17% of revenues) on capital investments, again the it will not be enough to keep up with the volume growth.
It's a pretty sobering picture - and will certainly lead to increase logistics costs maybe substantially.
More on all this soon.
Any Feedback on our Supply Chain Graphic of the Week? Let us know your thoughts at the Feedback section below.