Solar energy remains controversial in the US, with environmentalists seeing it as key salvation from a fossil-fuel centric energy landscape and rampant CO2 emissions, while critics say solar is a niche energy source that is dependent on government subsidies for survival and cite scandals such as the federal government's failed investment in solar panel maker Solyndra.
But despite all that, the economics of solar energy are starting to be quite compelling. A research report from Deutsche Bank this week, for example, predicts that solar electricity is on track to be as
cheap or cheaper than average electricity-bill prices in 47 US states by
in 2016, if the current 30% tax credit on system costs, set to expire
also in 2016, is maintained, a likely though not certain possibility.
But the report also says
that even if the tax credit falls to just 10%, solar will soon reach
price parity with conventional electricity 36 states. Current costs are much lower today than predicted as recently as 2010, for example.
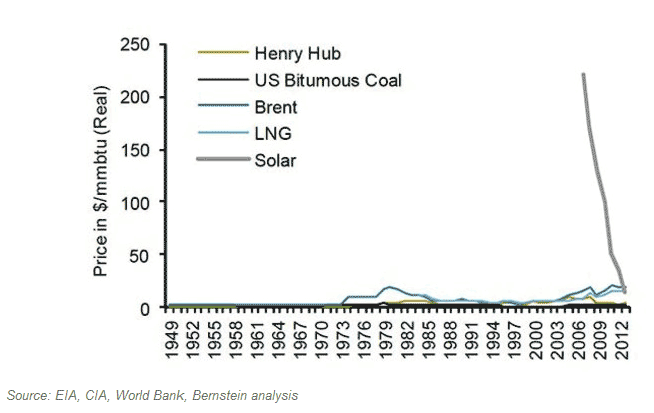
Pursuant to all this, we also found this chart, which shows the relative cost per milion BTU of energy from various energy sources over time, including solar, though solar wasn't even really tracked until about 2006. (Henry Hub is natural gas, FYI.)
Relative Costs of Common Energy Sources Per Million BTU

The decline in the costs of solar energy in less than a decade is astounding, now down to parity with other energy sources - and likely to undercut the others very soon.
The key factor? You can think of solar as a technology, where the cost and performance curve always improves, just like a microchip, while the grid is mostly powered by natural (and thus limited) resources, for which costs tend to rise.
All this of course can have big implications for the
supply chain. Solar projects for plants, DCs or office buildings that
perhaps did not look attractive from a financial perspective a few years
ago may look much better today or over the next few years.
Second, those internal
projects - or solar conversion by local utilities - could quickly help a
company reduce its total carbon footprint and help achieve or surpass
CO2 emissions goals.
Any Feedback on our Supply Chain Graphic of the Week? Let us know your thoughts at the Feedback section below.
|