We just finished up this week our Q4, 2013 review of rail carriers results and trends (see Rail Carriers See Generally Strong Results for Q4, Full 2013.)
While most of the four publicly traded Class I US railroads did pretty well (we assume Berkshire Hathaway's Burlington Northern did the same), the largest of these carriers, Unon Pacific, continues to log some impressive numbers.
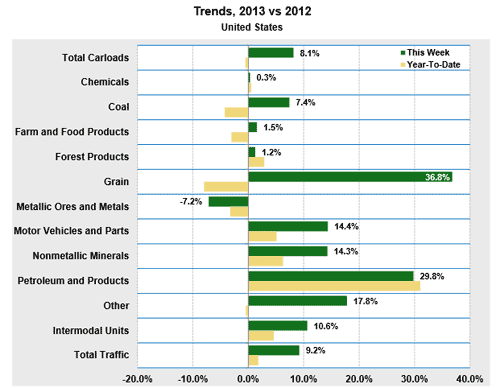
First, some context on the rail market. Below is a graphic from the Association of American Railroads that shows rail volumes by sector for 2013 (the full year numbers are represented by the tan-colored bars - the green bars are for the last week of the year and can be ignored).
As can be seen, for the full year of 2013, US railroads reported cumulative volume of
14,608,403 carloads, down 0.5% from 2012, and 12,831,692 intermodal
units, up 4.6% from last year. Total combined US traffic for the 52
weeks of 2013 was 27,440,095 carloads and intermodal units, up 1.8% from
last year.
Railcar Volumes 2013 vs 2012

Source: AAR
Union Pacific had slightly worse volumes overall than the industry as a whole, basically flat in total carloads and surprisingly also flat in intermodal units, an area most in which rail carriers saw decent growth.
But that didn't stop the UP profit machine from rolling on. Net income for the year was about $4.4 billion, up 11.3% from 2012. That also represented a highly impressive 20% of its revenue - and just think, not long ago this was a low profit industry. That has sure changed.
How does that happen on flat volumes?
1. Pricing power - UP saw core price rise about 4% in 2013
2. Relentless focus on operating efficiencies - UP continues to drive out costs
3. "Mix" changes - general merchandise volumes were up 3.4%, freight that is generally more profitable than say coal, which was down 8.9%
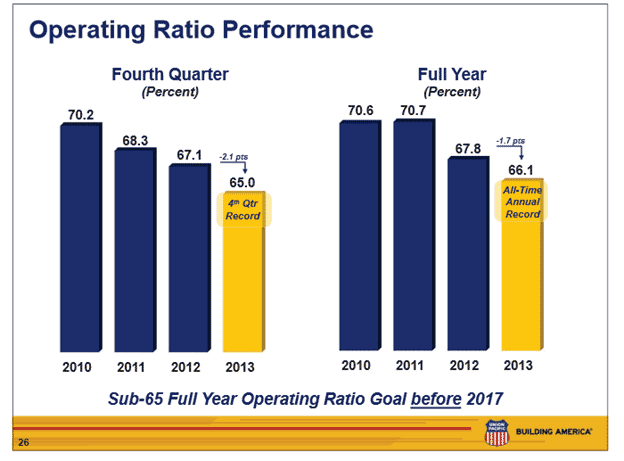
All that leads to continues improvement in UP's operating ratio, or operating expenses divided by operating revenue, a key metric in the transportation sector. Union Pacific was able to drive this down to just 65% in Q4, and 66.1% for the full year - both bests in the sector, as show in the graphic below.
Union Pacific's Continued Improvement in Its Operating Ratio

The company adds it is well on its way to a full year OR of 65% or less before 2017. By comparison, the unweighted average OR of the seven publicly traded truckload carriers we follow averaged about 89% in 2013.
UP clearly knows how to run a railroad.
Any Feedback on our Supply Chain Graphic of the Week? Let us know your thoughts at the Feedback section below. |