| |
|
| |
|
 |
Supply
Chain by the Numbers |
| |
|
| |
- June 20, 2013
|
| |
|
| |
|
| |
|
| |
Future Looking Bleak for Number of Truck Drivers; Volume Surged through Port of Tacoma in 2012; Impact of Interest Rates on Logistics Costs as Percent of GDP; Intermodal Growth Goes On and On |
| |
|
| |
| |
| |
115,000
|

|
|
|
| |
| |
|
|
15.9% |
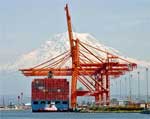
Strong gain in container traffic (TEU, actually) moving through the Port of Tacoma in 2012, for reasons not completely clear. That according to Rosalyn Wilson in the State of Logistics report from CSCMP this week. Other volume changes in select US ports in 2012 were as follows: LA:+1.7%; Oakland: +0.1%; Seattle: -8.0%; Long Beach: -0.3%; Norfolk: +9.8%; Charleston: +3.4%; New York-New Jersey: +0.5%; Savannah:1.9%. It appears Tacoma was in part stealing share from neighbor Seattle.
|
| |
| |
|
| |
| |
| |
42 |
|
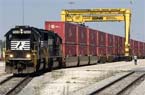
The number of consecutive months of growth in US intermodal traffic year-over-year in May, with the number of intermodal units up 4.1% so far in 2012 versus 2011. That even as overall rail car loadings are down 1.7% year to date. That according to Rosalyn Wilson in the State of Logistics report from CSCMP this week. In fact, May 2013 surprisingly saw the first year-over-year monthly total rail carload increase in 16 months, though the huge drop in coal volumes must be a factor.
|
| |
| |
| |
|
|
|
| |
|
 |
| |
|
|
| |

 Interestingly, the cost of logistics as a percent of US GDP that the US would have seen in 2012 if interest rates were at their 2007 levels for commercial paper of 5.07. That relative cost would be up quite a bit from the actual 8.5% of GDP the US saw in 2012 in this low interest rate environment. That according to Rosalyn Wilson in the State of Logistics report from CSCMP this week. Higher interest rates increase the cost of carrying inventory, one of the factors in total logistics costs – though we will note in a higher interest rate environment many companies would move to hold less inventory, perhaps mitigating the impact a bit.