Earlier this week, SCDigest published a story on the 2013 version of the "Top 10 Warehouse Networks," published annually by Chicago Consulting. (See What are the Best US Distribution Network Designs Based on the Number of Distribution Centers in the Network?)
The company looks at population numbers across the US, and then calculates the optimal distribution center locations for a single DC network, two DCs, three, etc. all the way to 10 facilities, based on lowest average lead times for customer delivery.
In the article, we included a table that has all 10 of these optimal networks both for 2013 as well as the one from 2006, just to see how the optimal network locations have changed over the past seven years.
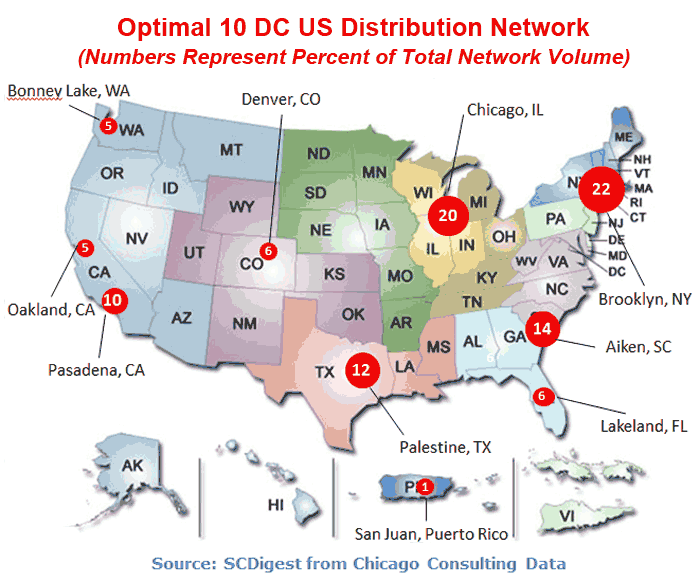
For our graphic of the week, we have plotted the optimal network for 10 DCs on a US map, with the numbers inside each circle representing the share of total network throughput for each facility. In other words, for example, the DC in Chicago would handle about 20% of total network volume, Oakland just 5%, etc.

If you have just a single DC, where is the optimal place to put it? Vincennes, IN, Chicago Consultants says, a city in the Southwestern part of the state near the Illinois and Kentucky borders. That's all things being equal, naturally - which of course they aren't. So that's where the challenge is.
Any Feedback on our Supply Chain Graphic of the Week? Let us know your thoughts at the Feedback button below. |