Two weeks ago, our Supply Chain Television Channel featured a truly outstanding videocast on Improving Forecast Accuracy At the Item-Location Level: How Demand Planning Leaders Are Doing It, featuring Jeff Metersky of consulting firm Chainalytics and Patrick Smith of supply chain planning software firm ToolsGroup.
It was one of our best and most popular Videocasts over the last couple of years. (See links below).
Metersky offered great insight coming out of data from a forecasting benchmark service Chainalytics offers that showed how comparing forecast accuracy across companies and setting goals for forecasting improvement is of modest value at best unless you understand the SKU profile of the companies. Some SKUs (high, stable demand) are obviously much easier to forecast than others (low velocity products with intermittent demand). Many other factors come into play (e.g., seasonaility, new product introduction, etc.)
That insight led Chainalytics to develop a "forecastability index" that helps companies better understand their accuracy numbers versus others, and in effect know the upper bounds of where they are likely to get from improvement efforts both overall and by specific product categories/forecastability profiles.
More on that soon.
Smith followed up with an excellent presentation that focused on a number of key areas that can lead to improved forecast accuracy - especially for the growing issue of slow movers and SKUs in the so-called "Long Tail."
That included a nice discussion of why "probabilistic" (also called stochastic) approaches to modeling and forecasting can deliver superior results for slow movers versus what traditional algorithmic techniques can achieve, according to Smith.
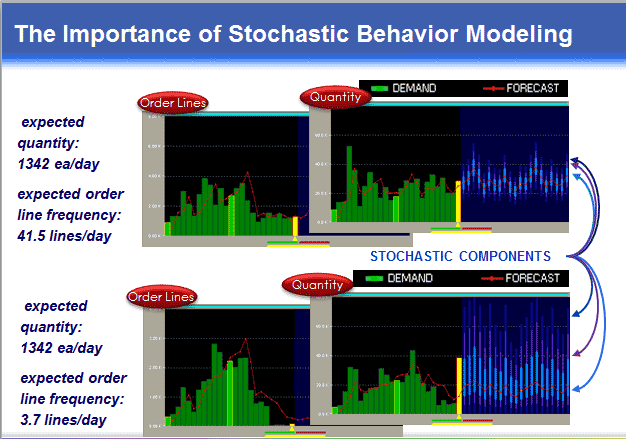
We can't possibly explain it all here (that's why there are the slides and the on-demand videocast), but this chart gives a reasonable summary.
A given level of historical demand (in this case, 1342 units per day over some period) can be the result of different orders patterns. In the top example, a much large number of orders (lines), obviously of lower average quantity per order, or fewer larger orders, as in the bottom example.

Source: ToolsGroup
|