The drive for leaner and leaner supply chains continues apace, and for manufacturers, that
meansin part optimizing what plants make what products for which markets.
Easy, right? Open up a spreadsheet, enter some data, and the answers should quickly become clear.
Not quite.
According to Dr. Mike Watson of IBM, on a recent videocast on The Supply Chain Television Channel, the effort is quite a bit more challenging than that.
He used the graphic below to show the key data inputs that are required to perform a comprehensive sourcing optimization analysis. (To see the full Videocast, go to: Sourcing Optimization in the Consumer Goods Industry.)
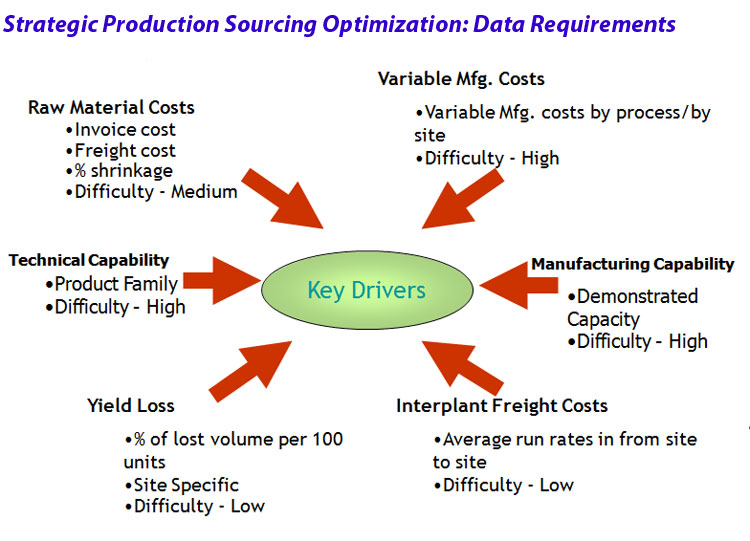
Source: IBM ILOG
We like the way Watson identifed the degree of difficulty of acquiring the different types of data, but Watson says all of it is available with some work, and is critical for getting the right answers.
Is it worth it? It depends, but Watson cited the case study of one large global CPG manufacturer that saved $50 million annually from such a sourcing optimization exercise. That's probably worth a decent effort at data collection.
Agree or
disagree? What is your perspective? Let
us know your thoughts at the Feedback button
below.
|


