We were intrigued by this graphic from a recent McKinsey Quarterly article on how CFOs can make cost cuts stick.
It shows trends in cost of goods sold (COGS) and corporate overhead (SG&A) from 1998 to 2008 (as a percent of corporate revenue) for the Fortune 500.
COGS and SG&A both have significant supply chain components, with the supply chain responsible for the lion's share of COGS in most cases and having a sizable impact on SG&A.
We were frankly surpirsed to see the strong drop in COGS as a percent of revenue starting in 2000 and bottoming out in 2006, but ending 2008 some 2.5% lower than a decade ago at about 61%. That obviously means company gross margins have increased by the same percentage.
SG&A has basically remained flat over the 10 years, with some ups and downs along the way, but starting and ending at about 22%, having reached a low point in 2005 at about 21.25%.
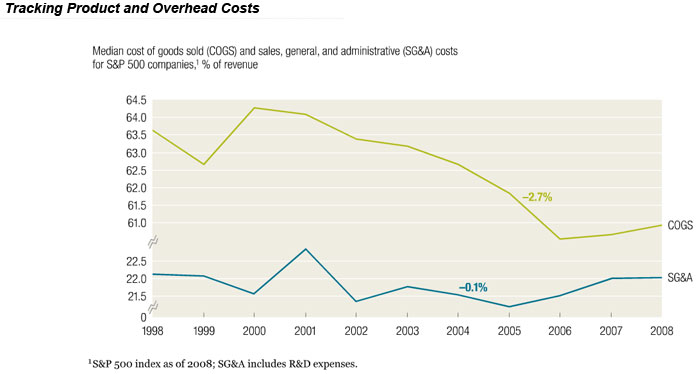
Source: McKinsey Quarterly
The article's point is that most often, cost cutting results don't last. McKinsey says
that "prior research found that only 10 percent of cost reduction programs show sustained results three years later." They note that too often, cost reduction efforts don't address the true drivers of cost, and are instead focused on unsustainable moves like sharp headcount reductions that leave companies needing to add back the people not long later to get the job done.
What was behind the significant 2.5% drop in COGS over the decade? There is no clear answer, though the dramatic rise of supply chain effectiveness, including offshoring, has to be the key factor from our view.
But we're actually surprised to see the COGS percentage of revenue drop and stay down for as long as it has. Generally, lower costs in the end beget lower prices, with the bump in gross margins overall being only temporary, as the price drops bring COGS as a percentage of sales right back to where they started.
Agree or
disagree? What is your perspective? Let
us know your thoughts at the Feedback button
below.
|


