| |
|
|
| |
|
|
 |
|
|
| |
-May 6, 2010 - |
|
| |
|
| |
Labor Cost per Unit Tops the List, but may have been Impacted by the Recession; Squeezing Out just 1% is Hard |
|
| |
|
| |
|
| |
In what areas of operational and financial performance have US manufacturers improved the most since 2006?
According to a recent study commissioned by MESA (the Manufacturing Execution Systems Association), the top six areas of improvement out of some 26 total metrics were as follows, as shown in the graphic below:
- Labor cost per unit
- Net operating profit
- EBIDTA (Earnings before Interest, Depreciation, Taxes and Amortization)
- Customer fill rate/on-time delivery
- Productivity on revenue per employee
- Productivity in value-add per employee
The numbers reflect changes in the responses from the most recent survey versus the previous one conducted in 2006.
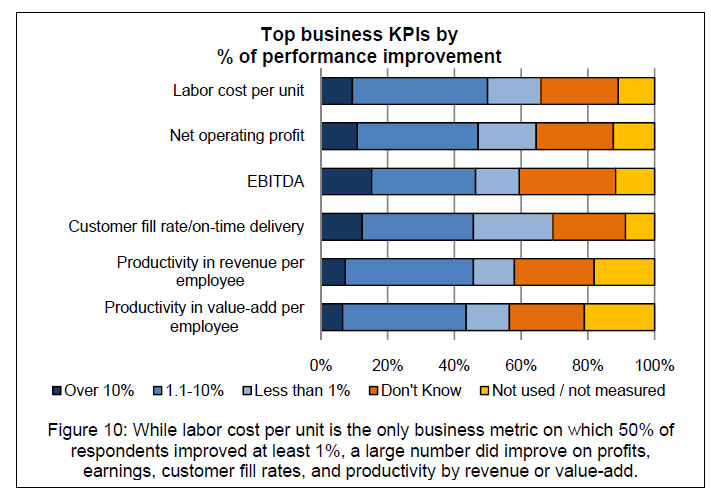
Source: MESA
According to the research, in only one area did more than 50% of the survey respondents improve performance by 1% or more: Labor cost per unit. Even that data is a little bit suspect, as the survey was taken in late 2009, amidst the Great Recession when most manufacturers had dramatically cut back on employment, meaning that result may have been an aberation.
What struck us from the data is just how hard it is to squeeze out manufacturing cost gains: cost reductions in most categories of jusr 1% were something of a major accomplishment for most manufacturers, according to the report. (See
Most Recent MESA Study Finds Progress but Still Lots of Room to Go in Manufacturing Metrics and Shop Floor Data Collection.)
Agree or
disagree? What is your perspective? Let
us know your thoughts at the Feedback button
below
|
|
| |
|
 |
|
| |
|
|
| |


