We received a lot of feedback from our piece last week on
Can - and Should - Western Manufacturing be Saved?
Apparently the folks at Forbes magazine were thinking the same way, as they did some work last week as well on this topic.
That's where we found this graphic, which on the Forbes web site is an interactive map that shows where the greatest concentrations of US factory employment are as a pecent of a metro areas' total work force.
In the static graphic below, the darker the shade of blue, the higher the percentage of the area's workforce that is employed in manufacturing.
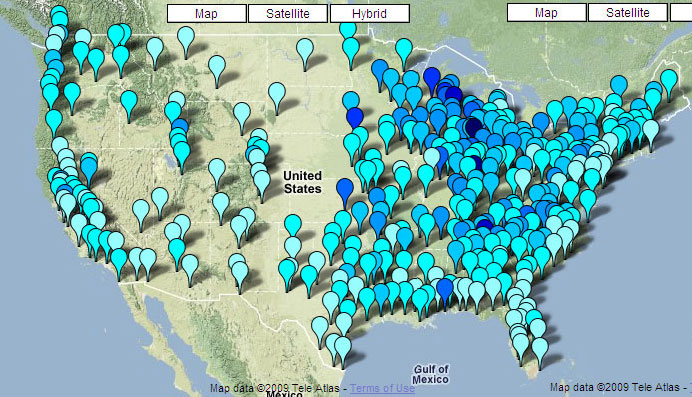
Source: Forbes
There are only three areas with the darkest blue indicator, meaning 20% or more of the workforce labors at factories:
- The Elkhart-Goshen, IN area, where an amazing 26% of the workforce is employed in manufacturing
- Columbus, IN at 21% (Cummins engines)
- Carpet capital Dalton, GA, at 20%
Most of the darker blue areas are concentrated in the Midwest.
One proviso - the numbers used were before the current recession. Things may certainly have changed.
The map is interesting - have a look.
Agree or
disagree? What is your perspective? Let
us know your thoughts at the Feedback button
below.
|


