| |
|
|
| |
|
|
 |
|
|
| |
-November 13, 2008 |
|
| |
|
| |
|
| |
|
| |
What industry sectors had the greatest changes in inventory levels?
The chart below, created by SCDigest from data in the latest CFO magazine/REL annual working capital report, shows the industries that had the greatest changes in average Days Inventory Outstanding (DIO) from 2006-07. As we note in a most extensive analysis, a decrease in DIO is in general a good thing, and an increase a not so good thing. (See
Digging Through the Inventory Numbers.)
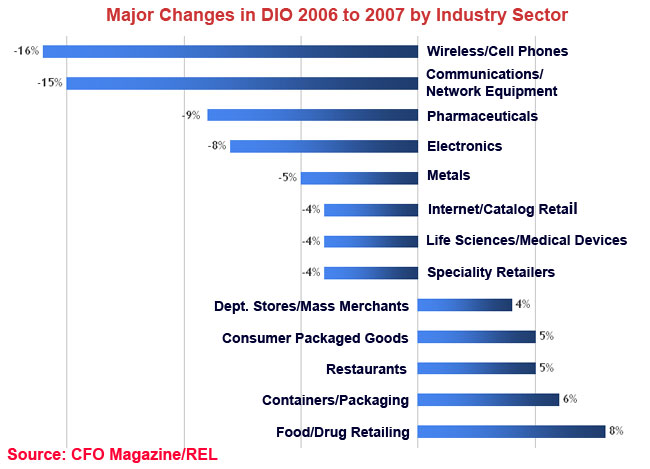
Industry sectors not listed in the chart had modest changes in DIO, in the range of +/- 2%.
Agree or
disagree? What is your perspective? Let
us know your thoughts at the Feedback button
below. |
|
| |
|
 |
|
| |
|
|
| |


