While most pundits expect oil prices - and therefore fuel surcharges for shippers - to head still higher,
Mike Rothman, an oil industry expert at research firm ISI Group, expects prices to move significantly lower (See
Which Way are Oil Prices – and Fuel Surcharges – Headed? Take Your Pick, as Expert Opinion Diverges).
Rothman offers an intriguing comparison of the move in oil prices over the last few years with the pricing pattern of 1973-1982.
As can be seen in the chart below, the pricing curves to date have an almost identical match (red is the earlier period, and blue the more recent time frame). At this point in the cycle in the first period, prices began a very strong move downward, dropping from approximately $30 per barrel to just over $10. To repeat, that's just $10 per barrel in 1986.
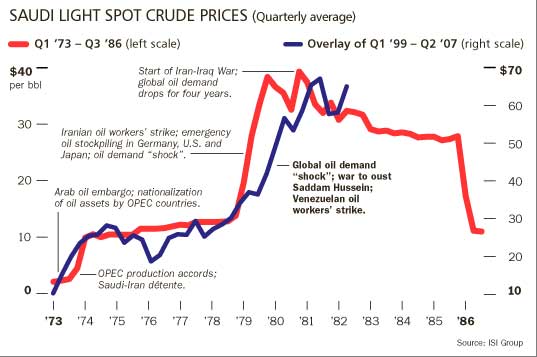
Rothman expects the same relative pattern to occur again now, as slowing demand and rising output change market dynamics. He is predicting per barrel prices of just $45-50 soon, versus the over $80 per barrel we see this week.
While Rothman is in the minority, the pattern match is certainly worth considering.
Agree or disagree? What is your perspective? Let us know your thoughts at the Feedback button below.
|


