The State of Global Energy 2023
I looked forward every year to the BP Statistical Review of World Energy, released by the company annually in late June. The review is a sort of almanac of all matter of energy related data, now in its 72nd year, and as always it is quite an interesting and educational read.
Except, it is somehow not the BP report anymore. It came instead as part of something called the Energy Institute, rather than BP alone. I don't quite understand the ramifications, other than one has to surmise BP is looking to reduce its costs in terms of producing the review each year..
The report is full of information on energy production and consumption. Energy of course is at the heart of supply chain in many ways, and central to our lives. A world of relatively cheap, abundant energy would bring prosperity and more income equality to much of the world.
| GILMORE SAYS: |
WHAT DO YOU SAY?'
Oil remains the top source, representing about 32% of the total, and interestingly trending up the last several years after a long period of a declining share.
Send us your
Feedback here
|
High energy prices have the opposite effect, as we learned in the 1970s, again in 2008 and now again in late 2021 and for much of 2022.
Energy costs can have a major impact on a variety of supply chain decisions, including network design and how to optimally navigate the tradeoff curve between inventory and transportation costs.
The report is focused on data from 2022, which included the Russian invasion of Ukraine in Q1, which sent most energy prices soaring, especially natural gas.
The report notes that "Whilst 2022 saw energy demand continue to recover from the COVID-19 pandemic, legacy supply chain issues, along with conflict in Ukraine, continued to impact the global energy sector."
While energy prices have trended down this year, the change has been moderate. Consumption patterns are likely the same in 2022 as so far here in 2023.
In the introduction to the report, and consistent with BP's heavy emphasis on climate change in recent years, the report comments that "We have seen further and ever more dangerous impacts of climate change across all continents. And despite broad consensus on the need to reach net zero, global energy-related greenhouse gas emissions are still heading in the wrong direction."
More on that in a moment.
The headline news from the report is that primary energy consumption grew a very modest 1% in 2022, after rising 6% last year due to low 2020 comparison numbers resulting from the pandemic that year.
With that 1% growth in consumption last year, it took the measure to around 3% above the 2019 pre-COVID levels.
The report also says carbon emissions from energy rose just 0.8% last year, a bit lower than the 1% rise in consumption, implying a small amount of energy CO2 efficiency, but again it set a new annual record any way.
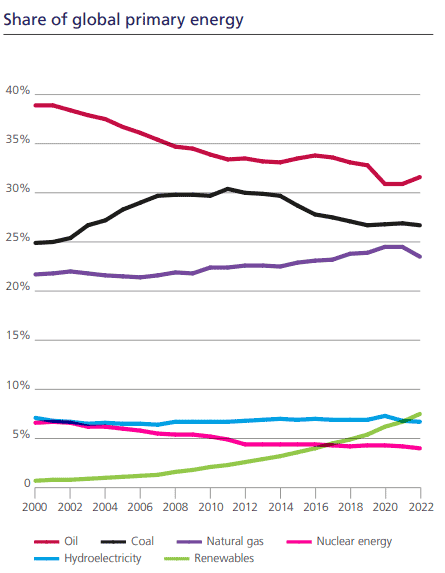
Illustrating that point, below you will find my favorite chart from the report each year, nicely summarizing global energy consumption from 2000 through 2022 by energy source:

As can be seen, oil remains the top source, representing about 32% of the total, and interestingly trending up the last several years after a long period of a declining share.
Coal comes in at number 2, with about a 27% share and maybe surprisingly flat for the past few years.
The share of renewable energy sources continues to see slow but steady growth, up to about 7% in 2022 from about a 3% a decade ago.
Nuclear's share continues to slowly decline.
Other interesting data points from the report include the following:
• Oil consumption continued to increase, rising by 2.9 million barrels per day (b/d) to 97.3 million barrels per day (b/d), a smaller increase than was seen between 2020 and 2021
• Coal consumption continued to increase, rising 0.6% to the highest level since 2014.
• Coal consumption in both North America and Europe declined by 6.8% and 3.1% respectively. In 2022, OECD county consumption was around 10% less than its 2019 pre-COVID level and non-OECD coal consumption over 6% higher.
• Renewable power (excluding hydro) rose 14% in 2022. This was slightly below the previous year's growth rate of 16%.
• Natural gas prices reached record levels in Europe and Asia in 2022, rising nearly threefold in Europe and doubling in the Asian LNG spot market. US Henry Hub prices rose over 50% in 2022 - their highest annual level since 2008.
Good stuff. The full BP report is available here: Statistical Review of World Energy 2023
Any reaction to the BP report data? Let us know your thought at the Feedback section below.
|

