State of the Logistics Union 2023
The Council of Supply Chain Management Professionals (CSCMP) and partners Kearney and Penske Logistics are out this week with the 2023 State of Logistics Report, looking primarily at 2022 data.
It is a mammoth effort, and one which takes six months from the end of the preceding year to produce the report in mid-June. The result of that time lag, seemingly unavoidable, is that the review of what happened in the previous year halfway through the current one makes the data modestly stale.
| GILMORE SAYS: |
WHAT DO YOU SAY?'
With overall tranport costs rising 7.6% per year over the past five years, comparing the rise in any specific areas versus that 7.6% overall number will indicate whether a mode gaining or losing share of total spend.
Send us your
Feedback here
|
The consultants at Kearney took over producing the report eight years ago, and I will say Kearney has done a good job providing the analysis of 2022 but also bringing in more timely data and trends.
Four Kearney consultants are cited as the report's authors, with shout outs to dozens of other people and organizations that helped.
Again this year, Penske Logistics funded the report development.
This is actually the 34th edition of the State of Logistics report, which was launched in 1988 by the late Bob Delaney and sponsored by his company, Cass Information Systems. Somewhere along the way, CSCMP took over the sponsorship.
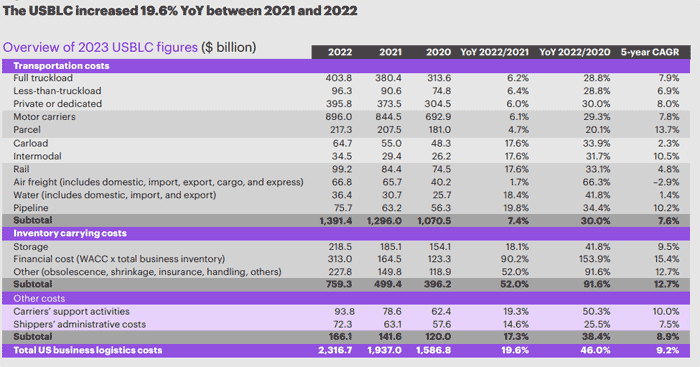
As always, the headline news: what the report several years back started calling US Business Logistics Costs (USBLC) rose sharply on an absolute basis in 2021 to $2.3 trillion. That was an increase of a huge 19.6% from 2021.
With a smaller increase in US nominal GDP (9%) than logistics costs rose last year (19.6%), that took the relative cost of logistics as a share of US GDP to a record 9.1% in 2022, up significantly from 8.0% in 2022.
To get to this key ratio, you take the amount of US logistics costs - from trucking to pipelines - and divide it by annual nominal (not real) GDP numbers. Voila, logistics costs as a percent of GDP emerges. The methodology must use nominal not real GDP as the denominator because the costs for the year are compiled in nominal terms, not inflation adjusted.
Oddly, this year's report again did not include the chart showing logistics costs as a percent of GDP for the last 10 year that always had been provided in the past, so I made my own using SOL report data, as shown below (note: I used the historical numbers provided last year in the report. It is possible they underwent some small unreported revisions this year):
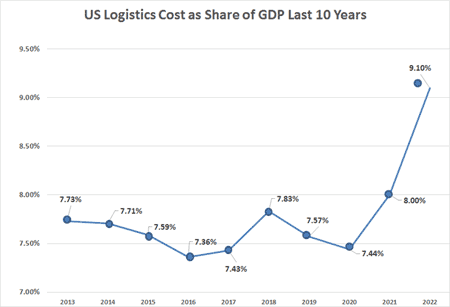
Source: CSCMP/Kearney
In 2013 through 2020, US logistics costs ranged between just 7.36% and 7.83% of GDP, rather remarkable stability, it seems to me. But now a big jump in the last two years.
In recent years, I noted you could say the US was overall making some progress in driving logistics costs down. Despite the modest jump in 2018, costs as a share of GDP in general have been trending down over the past decade, and that seen even with the high costs of ecommerce fulfillment embedded in the numbers. But the progress came to a halt last year and rose sharply again in 2022.
The peak in the past 20 years was 2007 (not on chart), when logistics costs hit 8.59% of GDP, close to where it was in 2008 (8.5%) before taking a steep drop in the recession year of 2009 to 7.4%. I will note the 2007-08 numbers were calculated using a somewhat different methodology than is being used now, meaning that the comparisons of those numbers to recent years is somewhat flawed, though I don't think by much.
Kearney says the average annual growth in logistics costs - again including inflation - is 9.2% over the past five years. My calulation is that GDP growth over the past 5 years is 5.5%, suggesting logistics cost have been rising quite a bit faster than the growth in the economy.
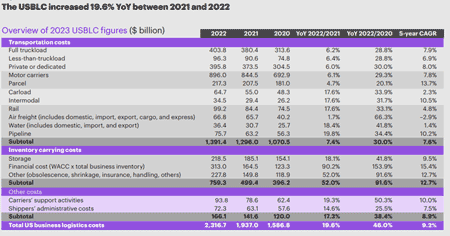
Underneath the overall logistics cost number, transportation costs - the largest single component of USBLC at 60.0% of the total (versus 65.2% in 2021) - was up 7.4%, and with an average of 7.6% annually over the past five years.
The second component of USBLC, inventory carrying costs (32.7% of the total, versus 27.1% in 2021), was up 52.0% last year under the report's calculation, which includes the cost of warehousing and inventory levels but also the cost of capital (which drives the cost of holding inventory).
With rising interest rates the cost of financing inventories spiked, while storage costs also soared with high rates for warehouse space.
"Other" costs - always somewhat vague and mostly involving tcertain IT expenses and some services such as freight forwarding - were up 17.3%, though this is by far the smallest of the three main categories at just 7.0% of the total cost number (versus 7.5% in 2021).
You can find the full breakdown by logistics cost bucket in the chart below:
See Full Size Image
Within transportation, trucking-related spend (including private fleets but excluding parcel) comprised 64.4% of total transport costs and 38.6% of total logistics spend, down from 43.5% in 2021.
Parcel shipping costs were estimated at $217.3 billion, up just 4.7% over 2021, slower than the 14.6% growth two years ago, as ecommerce slowed dramatically. That represented 15.6% of total transport costs and 9.3% of total logistics spend, the latter down from 10.7% in 2022. Over the past five years, parcel costs have risen by 13.7% on average, even with the slow 2022.
At $99.2 billion in 2022, rail comprised just 4.2% of transportation spend - about the same as 4.3% last year. Rail was also 4.2% of the total logistics costs, again about the same (4.3%) as in 2021.
The US thus spent about $118.1 billion more in parcel shipping than it did in rail transport last year - a bit less than a delta of $123.1 billion in 2022.
In terms of growth in spending by these various categories, the 5-year average annual growth rate in costs by mode or cost category are as follows, according to the report:
• Truckload: 7.9%
• LTL: 6.9%
• Private/dedicated fleet: 8.0%
• Trucking combined: 7.8%
• Parcel: 13.7%
• Rail: 4.8%
• Air freight: -2.9%
• Waterways: 1.4%
• Warehousing: 9.5%
For the second straight year there are some significant changes in some of these CAGR numbers versus the 2022 report, and I am not sure what caused these changes in just one year. I suspect the issue is actually revision of the prior data.
With overall tranport costs rising 7.6% per year over the past five years, comparing the rise in any specific areas versus that 7.6% overall number will indicate whether a mode gaining or losing share of total spend (note: that is not the same as tonnage share changes, though I suspect the numbers would be similar).
The report has a lot more detail on each mode and cost bucket, as well as on the overall economic and logistics environment, which I don't have room for here.
In addition to a lot of data on each transport mode, the report also includes special sections on sustainability (a repeat), and (new) network trends and logistics labor. I will review these in a follow up column.
My bottom line view: In a repeat from my review last year, Kearney and CSCMP continue to improve this report, and it is well worth a read. It continues to improve in integrating current trends and data with last year's numbers that are the heart of the report. But please bring back the chart showing the last 10 years of logistics costs a percent of GDP, and explain the big changes in 5-year CAGR numbers by mode in one year.
CSCMP members can download a copy for no charge, and others can purchase one for a modest fee. I recommend it.
Any reaction to our summary of this year's State of Logistics? How could the report be improved? Let us know your thought at the Feedback section below. |


