|
|
Supply Chain Year 2017 in Numbers and Charts
Wrapping up our review of the year in supply chain 2017, this week we offer our popular look at the past year in numbers and charts.
Last week, I summarized what I thought were the key supply chain themes and trends of 2017 (see Supply Chain Year in Review 2017). Then earlier this week, we published our excellent timeline of key news stories and events by month. Take a look - I guarantee you have forgotten a number of these important developments (see Full List of the Top Supply Chain Stories by Month in 2017).
| GILMORE SAYS: |
While the Cass Shipments Index was up 6.3% in November, expenditures were up 14.3%, implying rapidly rising rates.
WHAT DO YOU SAY?
Send us your
Feedback here
|
So, let's get right to it.
It was a generally strong year for the US economy. Q1 was strangely once again very weak, as it has been for several years now, with real US GDP up just 1.2%. But we've then seen growth in Q2 of 3.1% and 3.2% in Q3, with predictions for a strong Q4 as well. Just maybe full year GDP growth will be above 3% - something the US economy has amazingly not achieved since 2005, the longest streak on record.
Noted banker Jamie Dimon said this week that growth might reach 4% in 2018.
Additionally, the IMF's latest Fall estimate said "the global upswing in economic activity is strengthening, with global growth projected to rise 3.6% in 2017."
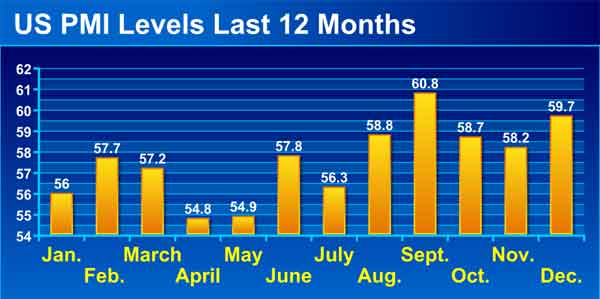
Consistent with the GDP growth, the US Purchasing Managers Index from the Institute of Supply Management was very strong in 2017, easily above the 50 mark that separates manufacturing expansion from contraction every month, as seen in the chart below.
In fact, the full year PMI average of 57.6 was the highest since all the way back in 2004. What's more, the December New Orders Index reached an incredible level of 69.4, in a very bullish sign for future US manufacturing activity.
|
|
Another view of US manufacturing strength is the index on output for US factories from the Federal Reserve.
As can be seen from the chart below, US manufacturing output has been flatish for several years now, and in general has been up 1% or less year-over-year for most of 2017. The recent uptick has pushed that to more like 2% growth - but still lukewarm at best.
|
|
With a score of 104.8, November US manufacturing output was just 4.8% above the average month in the baseline year of 2012, indicating very weak annual growth of less than 1% in the five years since.
What's more, as can also be seen in the chart, that also means 2017 output remains well below the peak year of 2007, when the index reached an historic high of 110.0 in December.
Oil prices had an interesting interesting year. As can seen in the chart below, WTI prices started the year at about $54 per barrel, but then had a bumpy ride down to about $43 in June. It was strongly up from their, reaching the 2017 high of $60.42 on the last trading day of the year.
|
|
There is now talk of $80 oil soon, but interestingly as prices climb it gets more US shale drillers back in the game, with new supply then pushing prices back down.
Naturally, US diesel costs roughly followed suit, starting the year at $2.58 and then staying within about 10 cents of that price through August before they started to rise, reaching $2.97 by the end of the year. That means diesel prices rose about 15% from beginning to end.
Commodity and input prices had a bumpy ride after strong gains in 2016, That after prices started collapsing in 2011 after a multi-year run, as shown below in a graphic (green line) of the IHS Materials Price Index (the index represents a basket of different commodity types). Prices ended the year a little above where they started, according to this measure.
|
|
The Scotiabank commodity price index showed stronger price increases, with the overall index up 21.1% through November, with metals and minerals up 22.1%, forest products 16.%, and agricultural products up 8.6%, though of course there were as always wide differences amongst individual commodities. Natural gas was down 27%, while palladium was up 51%.
Freight volumes all told were decent and accelerating as we ended the year. Through November, for example, the ATA Freight Tonnage Index was up 3.5% - but in November it was up 7.6% versus 2016. At an index level of 151, it means freight tonnage is up 51% versus the baseline year of 2000, which represents average annual growth of about 2.45%.
In November, the Cass Shipments Index reached its highest levels for that month since 2007. Indeed, in every month in 2017 the index has been above its 2016 levels.
All that naturally has pushing truckload rates higher - much higher. The Cass truckload Linehaul Index,which tracks truckload rates, was up year-over-year in November for the eighth month, with the level of the increases rising at year's end. The index was up 4.2%, 5.5%, and 6.3% in September, October, and November, respectively. |
|
While the Cass Shipments Index was up 6.3% in November, expenditures were up 14.3%, implying rapidly rising rates.
It was a decent but not great year for the railroads. Total combined US traffic 2017 was 27.5 million carloads and intermodal units, an increase of 3.4% compared to 2016.
2017 was a much better year for ocean container carriers. The China Containerized Freight Index ended the year at about 775, versus the baseline year of 1998 (index = 1000).That, however, was below where we started 2017, at just over 800, and the peaks of about 875 in Feb and Aug. But those were all better than lows of around 600 in mid-summer 2016, as rates more or less climbed steadily from then until August 2017before starting to the fall to 773 or so by year's end.
IMF recently projected that the volume global trade would be up 4.2% in 2017, up from 2.4% in 2016, and once again back above global GDP growth, which used to always be the case until recently.
The China Containerized Freight Index ended the year at about 775 (versus 1000 in the baseline rate in November, 2012), below the start of 2017 at just over 800 and peaks of 875 in Feb. and Aug. All better than the lows of around 600 in mid-summer 2016, as rates more or less climbed steadily from then until August 2017 before starting to the fall to 773 or so by year's end.
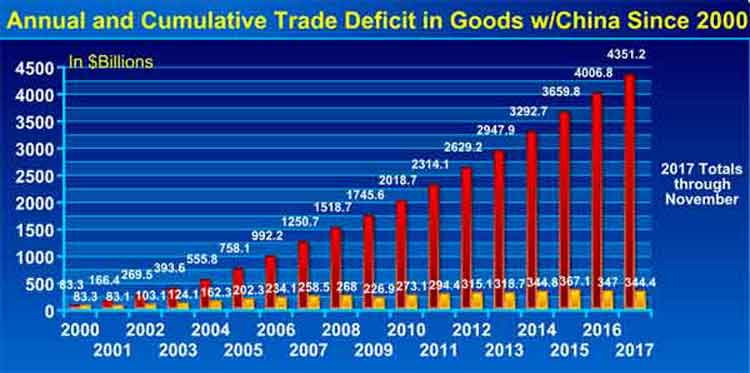
The US trade deficit continued along, coming in about $45-50 billion each month, up from $40-45 billion in 2016 but down from about $60 billion per month pre-recession. The trade deficit in goods with China also stayed strong, at about $344 billion through November, looking like a lock to exceed the previous record of $367 billion deficit in 2015. The cumulative US trade deficit with China since 2000 is about $4.3 trillion, as shown in the chart below.
|
|
The growth of ecommerce sales in the US also rolled on, up 15.5%, 16.0%, and 15.4% in Q1 through Q3, respectively. E-commerce represented 9.1% of total retail sales in Q3, by the government's calculation, but the way SCDigest figures it, the share is probably now over 11%. Total retail sales were up a strong 4.5% or so in 2017, but ecommerce continues to rapidly gain share.
Amazon's is somehow growing even faster, with overall revenues through Q3 up 27.3% to $117.4 billion, meaning full year 2017 sales will be close to an "Amazonazing " $180 billion.
Amazon product sales though Q3 were up 20.6% to $77.billion, with the rate of growth slowing. But Amazon saw 42.1% growth in services, which includes its marketplace, fulfillment by Amazon, and web services. Amazon had profits through Q3 of $1.17 billion, but that's down from $1.62 billion in 2016.
I have lots more but am out of space. Hope you enjoyed all this.
What is your reaction of supply chain 2017 in numbers and charts? What would you add? Let us know your thought at the Feedback section below. |

|
 |
|
| |
|
|
New Videocast: |
Yes, Retailers and Distributors Can Survive and Thrive by Unifying Commerce and Supply Chain
|

|
Integrated Approach will Improve Customer Experience as Smart Retailers Move Beyond Omnichannel
This videocast discusses how to connect people, processes and technology across commerce and supply chain operations to achieve unified commerce.
Featuring Dan Gilmore, Editor and enVista CEO Jim Barnes, a highly recognized industry expert on retail and distribution.
|
 |
| Tuesday,
January 30, 2018 |
|
On Demand Videocast: |
The State of Retail-Vendor Supply Chain Relationships 2017
|
 |
Results from SCDigest's Second Biannual Benchmark Study of Retailers and Their Vendors - and SCDigest's New Index to Measure State of the Relationships
These findings are being presented in a live panel discussion with interactive questions from audience members throughout.
Featuring Dan Gilmore, President & Editor-in-Chief of Supply Chain Digest plus Greg Holder, CEO, Compliance Networks, Kim Zablocky, President, RVCF (Retail Value Chain Federation)
and Victor Engesser, Retail Executive Advisor, RVCFP.
|
 |
Now Available On Demand |
|
On Demand Videocast: |
The Modern Control Tower: Orchestrating Your Digital Supply Chain |

|
What is a Supply Chain Control Tower and What Does It Do?
These experts will discuss how operational control towers have evolved past their visibility and transportation roots to focus on taking action for every end-to-end customer order across the multi-party supply chain.
Featuring Dan Gilmore, President & Editor-in-Chief of Supply Chain Digest plus Martin Verwijmeren and Brian Hodgson of MP Objects.
|
|
| Now Available On Demand |
|
|