Comparison Across Industries
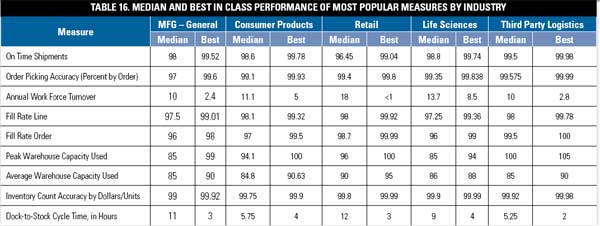
For most metrics tracked in the report, such as on-time delivery percentage, inventory accuracy, picking accuracy, and order fill rates, there were relatively small differences in median performance levels between industries. Even so, small absolute differences can actually be quite important. For example, the 2.4% difference in order picking accuracy between general manufacturing (97%) and retail (99.4%) actually would represent a large cost difference resulting from picking errors, and probably does represent the result of a different level of focus on this problem between the two sectors.
A couple of other areas stand out. As shown in the graphic below, for example, the annual associate turnover in retail distribution, at 18%, was well above most other sectors. 3PLs seemed to rate their performance higher than all other industries in almost every category. Whether this is reality, a desire to look good on the part of the respondents, or differing views on how the metric should be calculated is not clear.
Source: WERC/Manrodt and Vitasek
Some Metrics Show Consistent Improvement
What we found perhaps most interesting was the list of metrics for which performance had changed the most over the past three years. Most of these changed for the better – for example, the percent of back orders as a percent of total orders dropped from a median of 5% in 2005 to just 1.9% in 2008.
Lines picked and shipped per person hour rose from a median of 21 in 2005 to 35.3 in 2008, while cases picked per hour went from 110 to 120 over the same time. The percent of orders shipped complete rose from a median of 96% to 98% in 2008, which sounds high to us but that’s what the data says.
One metric that declined substantially was “Days on Hand of Raw Materials,” which the study data found rose from a median of 20 days in 2005 to an incredible 61.9 days in 2008. Manrodt and Vitasek attribute the change to the fact that “more and more companies are acquiring their materials overseas. Unless the company is shipping by air, they are likely to see an increase of 4 weeks (30 days) of incremental inventory because of product being held in inventory as it is transported over the water.”
True, but the level of increase from 2005 to 2008 still seems abnormally large. There may have been some other issue with how respondents answered the question, though the data was really consistent for high performing companies too, where Days on Hand rose from 10 to 20 over the same period. We wonder if it could simply be an issue of the respondent – distribution managers may not have a clear view of manufacturing inventories.
In looking at the data, Manrodt and Vitasek note that “There has been marked improvement in companies’ ability to deliver with regard to the Perfect Order. And executives are supporting measurement as a key practice in most organizations. Lastly, leading industries such as grocery retailers are beginning to think outside the box and begin to institute a number of cross organizational metrics to better measure overall performance versus company silo performance.”
More on that last point soon.
What’s your reaction to the 2008 DC Metrics data? Could raw materials inventories have really increased that much due to offshoring? What metrics are missing that should be there for the top 10 most used metrics? Let us know your thoughts at the Feedback button below. |