How has the practice of inventory management performed over the past decade?
One way to take a look is through the overall inventory-to-sales ratio, a metric tracked both for the overall US economy and for a variety of specific industry sectors by the US Census Bureau. As the name implies, it looks at aggregate level of inventories being held by businesses versus the level of sales.
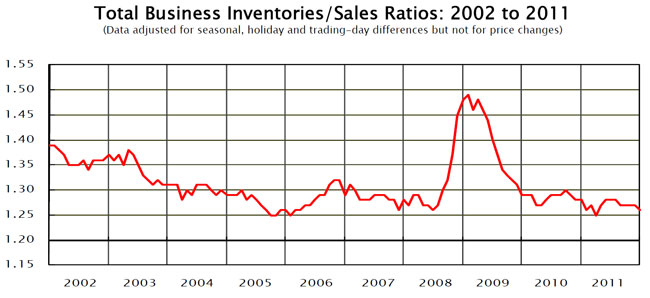
Below, you will find a 10-year look at the ratio, as published in the this month when the January numbers were announced.
Source: Census Bureau
For several decades, the trend in this ratio overall has been down, down, down, and that can be seen over this most recent 10-year period, during which the metric has fallen from about 1.40 to 1.25 - actually, an impressive level of improvement.
We reached 1.25 or close to its several times earlier in the decade, such as at the end of 2005 and then again in mid-2008, right befire the financial crisis and recession - which causes inventory levels to soar as the supply side couldn't react in time to the drop in demand.
How low can we go? We'e not sure, but are reasonably confident 1.25 is not the floor.
Have a comment? Send it at the Feedback button below.
|


