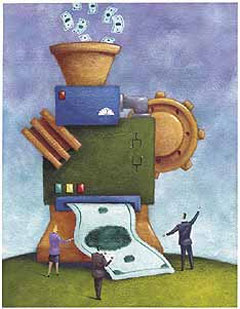
|
In 2011, I wrote one of my most popular columns in the 10 years of SCDigest, on what I called "A Little Supply Chain Finance 101." That piece, which later was turned into a video version, connected the key financial concepts of the income statement, balance sheet and cash flow statement, largely explaining how changes in inventory levels ripple through each of those important financial calculations.
So, at the time of that column and video, a number of readers sent in comments to the effect of "keep this supply chain finance stuff coming."
Gilmore Says: |
 Whether you use inventory turns, DIO, COGS, day's revenue - those are just numbers for making comparisons. In terms of a company, it's the actual dollars that matter. Whether you use inventory turns, DIO, COGS, day's revenue - those are just numbers for making comparisons. In terms of a company, it's the actual dollars that matter.

Click Here to See
Reader Feedback |
Now combine that with several emails we have received since our review of the annual worker capital numbers from the analysts at REP, a Hackett Group company, relative to our follow up analysis on inventory changes and how long it is taking companies to pay suppliers (key components of working capital and cash flow), and we are advancing this week to Supply Chain Finance 102.
So, let's start with reader feedback, which every year we have done this with the REL data has generated reader complaints about the calculation. For its purposes, REL analyzes the three components of working capital: changes in how long it takes a company to get paid by customers (accounts receivable), changes in inventory levels, and changes in how long it takes companies to pay suppliers (accounts payable).
Decreases in accounts receivable and inventory reduce working capital and thus improve cash flow. It's the opposite for payables, where an increase in payables (meaning stretching out payments to suppliers), whether good business ethics or not, drives working capital and cash flow improvements.
REL measures performance in inventory and payables in terms Days Inventory Outstanding (DIO) and Days Payables Outstanding (DPO), respectively. This is where the criticism we get begins.
REL calculates DIO as:
End of Year Inventory Level/[total revenue/365]
It similarly calculates DPO as:
Year-End Accounts Payable /(Total Revenue/365)
The key element of these definitions is the use of revenue - more precisely a day's worth of sales - as the denominator in the calculation, rather than cost of goods sold.
So, here is the simple answer. I spoke with REL's Prathima Iddamsetty, who was very involved in REL's working capital analysis. She agrees that Yes, using cost of goods sold would probably produce a somewhat better measure, at least internally, rather than using a day's worth of sales as the divisor.
But the REL approach has to be viewed as a total system. The other factor in terms of working capital is receivables, or Days Sales Outstanding (DSO). It hopefully is obvious that the idea of using cost of goods sold for DSO calculation isn't remotely applicable. So, the only way to have a unified system is to use the same denominator for all three components, which is a day's worth of sales (revenue/365).
And that system can completely explain/calculate a company's change in its total working capital relative to a sales day. So it has 100% percent internal integrity.
That said, two other points: (1) I think measuring inventory and payables performance in terms of their relationship to a day's worth of sales is a fine way to think about both of these metrics; (2) while the absolute numbers would be different if you used COGS (and be lower), I highly suspect the rankings of industry sectors or companies within a sector would be little changed using a COGS basis.
So, I went through all of that just in part to defend and clarify why REL does what it does, but to further explain some essential elements of supply chain finance, which I am still learning.
 In a guest column last year, David Schneider argued that operating cash flow was the single best metric to measure supply chain performance. You could debate that I suppose, but cash flow is unquestionably an essential and sometimes not well understood measure. In a guest column last year, David Schneider argued that operating cash flow was the single best metric to measure supply chain performance. You could debate that I suppose, but cash flow is unquestionably an essential and sometimes not well understood measure.
I have written this before, but overall cash flow is an core metric for many stock market analysts. So-called "sell-side" analysts focus on earnings per share (EPS) changes, but "buy side" interests (think the California pension fund and many private equity firms) focus on cash flows. In great summary, they project out a company's free cash flows over many years, and then calculate what those future cash flow are worth in terms of a price today.
If a company's stock is selling for well below that discounted cash flow value, it could be a very profitable investment.
Cash flows are different than accounting profits, which include all kinds of depreciation and other accounting entries. Trust me, even as a small business here at SCDigest it's clear
hat cash flow - how much is coming in versus how much is going out - is the best measure of the health of the business.
Supply chain finance consultant Gerry Marsh has many examples of how there can be two companies in the same sector, with similar levels of EPS and EPS growth, yet one company has a much higher stock market multiple than the other. Why? Because the higher stock price company generates greater cash flow from its sales than the other. That means each dollar of sales is worth more.
Marsh has told me that a minority of CEOs and even CFOs well understand this. They are focused on the sell-side analysts and EPS.
Let's explain this in part by looking at Amazon.com. Despite increasing revenues some 22% in Q2, Amazon once again was modestly in the red last quarter, losing about $7 million, as it continues to struggle to reach solid profitability.
Yet, its stock price keeps chugging along. Now part of that is surely related to Amazon's rapid revenue growth rate and the potential for much greater EPS in the future (that has been the story for an very long time, it seems).
But the other part may be the investors looking at cash flow. While losing $7 million in Q2, Amazon's cash flow from operations increased from $594 million in 2012 to $880 million this year - up 48%. (There are also cash flows related to financial or investing activities, such as borrowing money, repaying debt, taxes, etc., that combine with operating cash flows to determine total cash flow for a company.)
And how does the supply chain impact those operating cash flows?
Increasing gross margin dollars by reducing costs: Alternatively, however, a company (such as Amazon) may decide to use those lower product costs to decrease price to gain market share or to meet competition, which is also reducing costs. Still, a dollar of cost saved is a dollar of cash flow either achieved or preserved.
Reducing inventory: Despite sales rising 22%, and product sales up by about $2 billion, Amazon increased its inventory by just $30 million in Q2. Inventories naturally rise in most cases with growing sales volumes. In general, it's good to see inventories rising less quickly than sales, as Amazon clearly achieved in Q2. In the mid-2000s, Walmart found itself in the opposite situation - inventories growing much faster than sales, which led to the Inventory DeLoad initiative and other programs. Not exactly right, but close, the difference between gross margin growth and the growth in inventory levels goes straight to cash flow.
Reducing receivables: This in part is out of the supply chain's hands, but clearly late shipments or those that have item or paperwork accuracy problems will delay payment from customers, often for weeks. Back orders play in here too - it delays when a company will get its cash from customers. Retailers are different than others given the payment is often near instantaneous, but in Q2 Amazon increased it receivables by $211 million, which is a negative for cash flow. I am assuming this is simply the result of the rapid revenue growth, and would have been more than overcome from increases in gross margin dollars.
Increasing payables: If the sourcing group slows down payments to vendors, that's cash the company keeps for a longer period of time. The trend is very much to keep pushing out those terms, rightly or wrongly. Procter & Gamble announced earlier this year it was extending terms from 45 to 75 days. Analysts calculated that when complete, this would generate an extra $2 billion in annual cash flow for P&G. Amazon's payables were flat.
Working capital is calculated from changes in inventories, payables and receivables, in the end in real dollar terms. Whether you use inventory turns, DIO, COGS, day's revenue - those are just numbers for making comparisons. In terms of a company, it's the actual dollars that matter.
Changes in working capital up (bad) or down (good) flow directly to the cash flow statement. And that's how many on Wall Street analyze and value a company, private or public. That's it for today's class.
Did you find this Supply Chain 102 piece useful? Anything to add? Let us know your thoughts at the Feedback section
below.
|

