Update: Last week, ISM announced that the US Purchasing Managers Index for June came in at 49.7, breaking a streak of 34 straight months in which the measure was above the 50 level that separates expansion from contraction. New Orders fell off the cliff from 60.1 to 47.8, which is also the first
sub-50 reading since the recovery, suggesting quite a sharp reversal
from expansion to contraction. Also, the prices component fell from 47.5 to
37.0, the lowest reading since the recovery.
These data points unfortunately all support the trend towards a slowing global economy and manufacturing sector discussed below.
For the third consecutive year, the UAS economy appears to be softening as we head into summer. Whether that will once again also lead to a recovery in the Fall is far from clear, as the economies are wobbling globally, and the US manufacturing sector, which has carried much of the economic load in the modest recovery, is going a bit soft.
SCDigest Says: |
 That left manufacturing capacity utilization at 77.6%, 1.2 percentage points below the average of 78.8% seen between 1972 and 2011. That left manufacturing capacity utilization at 77.6%, 1.2 percentage points below the average of 78.8% seen between 1972 and 2011.

Click Here to See Reader Feedback
|
On Friday, the US Federal Reserve released data on US industrial output and capacity utilization for May, and the news was mixed at best.
Manufacturing output (which excludes the mining and utility data that is in the full industrial output numbers), fell .4% in May, continuing a generally declining trend since the end of 2011. Although the full industrial numbers tend to largely mirror the manufacturing only changes, factors like unusually cold winters or hot summers can impact utility output totally unconnected to the larger economy, so we prefer the pure manufacturing number.
As shown in the graphic below, manufacturing output has clearly been on a declining trend since last December, with a minor exception in April that was still below the type of growth seen in December and January. For the past 12 months ending in May, however, manufacturing output is up 5.2%, but most of that occurred in 2011.
A similar story can be seen in terms of manufacturing capacity utilization. This metric has risen steadily since it reached bottom in June of 2009 at 63.8%, but fell .4% in May, just as the country was poised to see it reach its long term average.
That left manufacturing capacity utilization at 77.6%, 1.2 percentage points below the average of 78.8% seen between 1972 and 2011. In January of 1989, manufacturing capacity utilization reached 85.5%, and was regularly above 80% for most of the 1990s.
Manufacturing capacity in total has risen .9% over the last 12 months.
US Manufacturing Output has Been Falling in Last Six Months
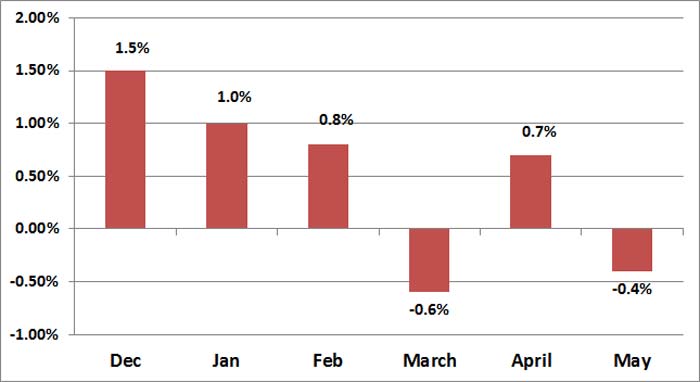
Source: SCDigest, Federal Reserve
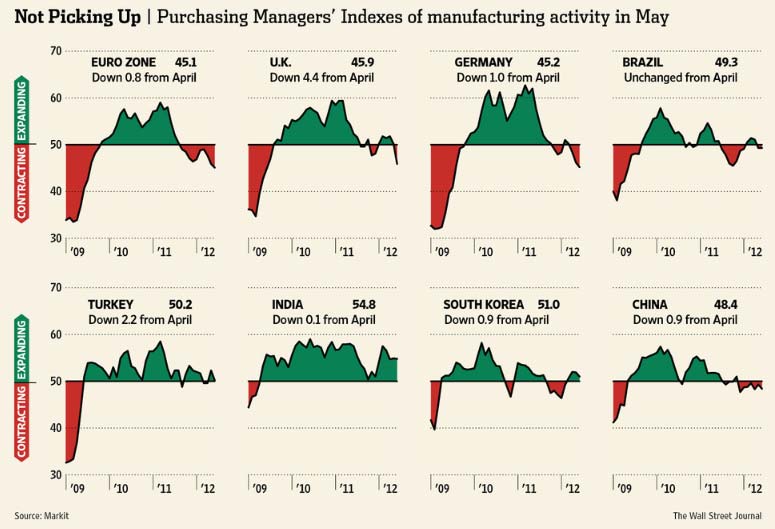
Economies Across the Globe Are Wobbling
Economies across the globe are catching a cold of late, primarily but perhaps not exclusively from the financial and economic woes in Europe.
(Supply Chain Trends and Issues Article - Continued Below)
|