Diffusion Index Approach
The primary and most widely reported index is the overall PMI score. That metric, in turn, consists of an average of the seasonally adjusted indexes in five core areas:
- Production (20%)
- New Orders (20%)
- Employment (20%)
- Supplier Deliveries (20%)
- Inventories (20%)
The weighting used to be different across the categories, but in 2008 the PMI was changed to give equal weight to these five categories to improve the correlation between the PMI and US Gross Domestic Product (GDP).
PMI survey respondents are asked to give very simple answers for each of these five categories plus several others that aren’t included in the formal PMI calculation, such as order backlogs and imports, but which are reported in the full The Manufacturing ISM Report On Business. The questions in summary are as follows: In your company, for this month, was the level of activity/volume in each category higher, lower, or the same as the prior month?
So, answers for April, 2010, are relative to March, 2010. ISM then tweaks the overall responses a bit to reflect known seasonal patterns (e.g., orders may naturally rise in September versus August, so that pattern is normalized in the final numbers to represent true directional change).
This approach is what is called a “diffusion index,” a statistical technique used to represent patterns of change.
The actual score for each category is then calculated by taking the percentage of respondents who say activity is increasing and adding it to half the percent of those who say the area has stayed the same.
So, for example, if 40% said order volumes increased, 32% said they stayed the same, and 28% said they declined, the index for orders would be 40 plus 16 (one-half of 32) for a total of 56.
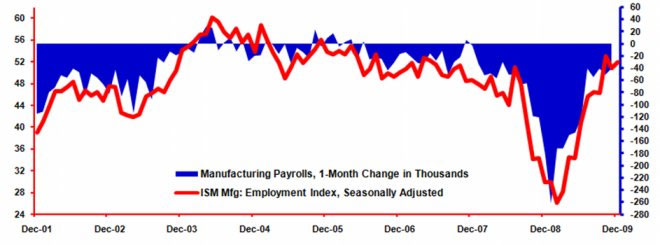
The ISM Data is Shown to Closely Track Ultimate Economic
Data Reported Several Months Later
This then results in the well-known scenario where scores above 50 are generally said to represent expansion, and under 50 contraction in the overall economy (for the full PMI) and each specific sub-category category. The distance from 50 generally indicates relative strength or weakness and rate of change from the previous month.
So, if the PMI goes from 56 to 52 in a given month, it means the economy is still expanding (index over 50) but at a slowing rate (decline of 4 points over the previous month). A change from 53 to 48 means the economy (or that area) has gone from expansion to contraction.
Well, almost.
The inventory category is a bit different, Ore says, than most of the others. Data has shown that any score above 42.6 is actually likely to represent growth in overall US inventories as reported several months later by the US Commerce Dept., based on the Commerce Dept.’s own analysis.
Why? Well, in part it may be the natural tendency for supply managers to think they have well managed inventories for a given period, and so the responses have a bit of a natural bias downwards.
“You see that in normal times, the inventory scores tend to hover in the 44-47 range, which I think represent steady state levels,” Ore told us.
“The PMI and the indexes are meant to provide a very current snapshot of activity and the direction of the economy,” Ore said, “History has shown that it does a very good job of that,” noting that ISM has frequently gone back to compare ISM data to government statistics, which take longer to develop and report (see graphic above).
“So, not only has have the indexes proven to be highly accurate over time, the speed of the reporting gives managers valuable insight into how the environment is changing,” Ore said.
Did this help your understanding of the ISM PMI and other indexes? Do you look at these numbers each month, and find them useful? Any changes you would like to see? Let us know your thoughts at the Feedback button below.
SCDigest is Twittering!
Follow us now at https://twitter.com/scdigest |