Cliff Holste, Materials Handling Editor Cliff Holste, Materials Handling Editor
Last week, SCDigest and Distribution Digest released a "beta" version of a new Distribution Center Complexity Calculator™, developed as a result of several reader questions about how to measure DC complexity. The catalyst for these requests was often questions about the level of software support (WMS) required to help manage operations (see New Distribution Complexity Calculator Beta Version Released).
We have received several comments and suggestions and more than 50 users of the web version of the calculator thus far. We do not track the specifics of who uses the web version of the calculator, but we do track the numeric responses anonymously (see below).
A couple of observations have come from seeing the early results.
First, the average score thus far is a 54, on a scale of 1-100 (though really the lowest score one can achieve is 18). The high thus far is a 76; there have been a few in the 30s, with the majority in the 45-55 range, and a handful of upper 60s.
What this tells us in part is that the idea of using a 1-100 score to reflect our normal sense about "grades" is probably not going to work. Absent some changes, the average DC is going to score about 50, which actually makes quite a bit of sense.
As we have thought about it some more, we also believe that there is probably no existing DC that would score more than about 85-90 on this scale, because no one is at the max across all attributes (though we really are checking with Walmart and others of that sort to confirm that assumption).
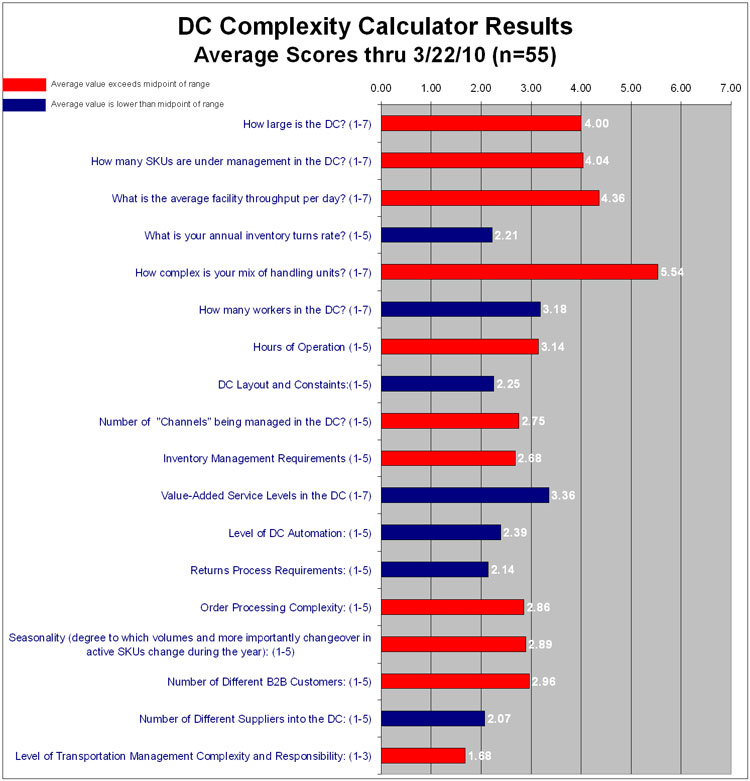
Below, you will find a graphic of the average scores thus far on each of the 18 attributes. The color of the bar indicates whether the average of the scores thus far, through 55 calculator takers, are above (red) or below (dark blue) the midpoint of the scale (i.e., 3.5 on a 1-7 scale).
We may make some adjustments based on this; for example, shifting the number of suppliers managed to the right (in effect adding a point to most takers).
This truly is meant to be a collaborative effort; we need your comments and feedback to come up with the final DC Complexity Calculator 1.0. Please send your comments here: feedback@scdigest.com.
Below is the data thus far. On the bottom half of the page is the calculator itself.
(Distribution Article - Continued Below)
|