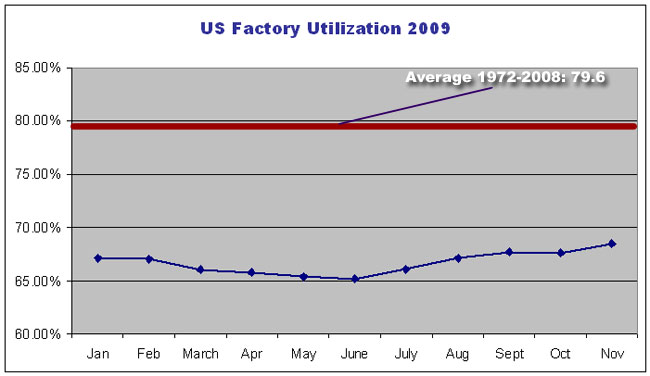
In a sense, the story was even worse in terms of factory utilization, which plummeted even below levels of the severe recession in 1981-82 to rates not seen since the Great Depression.
As shown in the chart below, US factory utilization remained below 70% for the entire year, versus an average of almost 80% for the period between 1972 and 2008.
Part of the problem, in a sense, is that unlike many previous recessions, less capacity than normal left the market given the drop in demand. The auto industry provides a good example of this, as many US factories stopped producing vehicles for weeks or months, especially in the first half of the year, but very few if any of these plants as yet have actually closed.
In fact, the Federal Reserve reports US manufacturing capacity has only declined about 1.2% since November of 2008 - a low drop by historical standards given the severity of the recession.
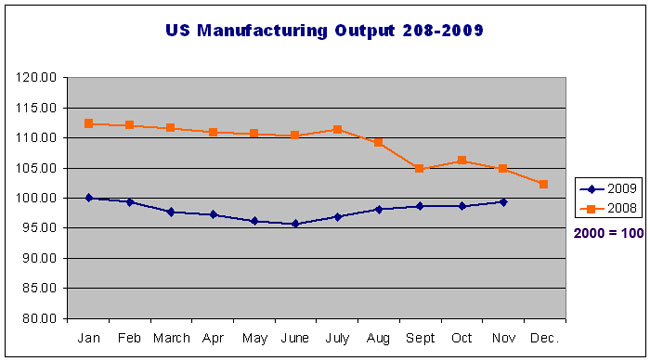
As with output, factory utilization bottomed in June, at about 65%, and has made a modest recovery since then, to about 68%. However, there is still a long way to go to get back to historic levels.
Source: Federal Reserve Data
As usual, however, the impact was not evenly felt across manufacturing sectors. While every single sector has had a decline in utilization since the Dec. 2007 peak, the damage ranged from an incredible 31-point decline in utilization at metals producers and 25 points in the high-tech sector, to nearly flat in the oil sector, and just a 2% decrease in food factories. You have to keep eating.
Paper, plastics, electrical equipment, apparel, and textiles all saw utilization drops of between 10 and 20% from the peak. Chemicals dropped about 8%.
ISM Data Reason for Optimism
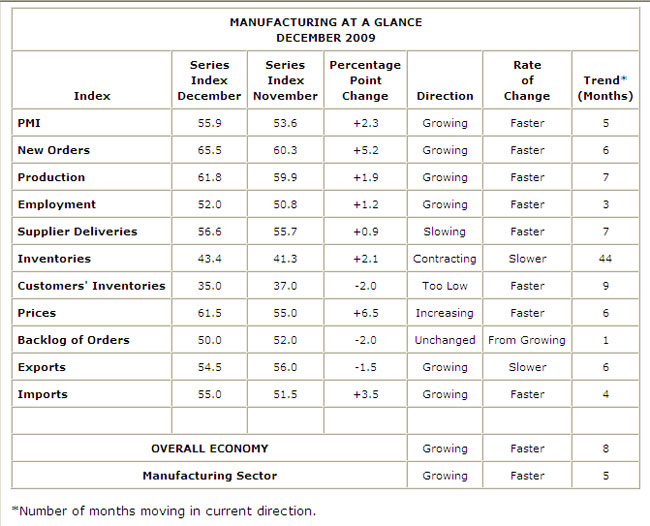
In addition to the rising numbers in output and utilization, fresh data from the Institute for Supply Management (ISM) also give reason for optimism for the coming year.
Just released today, the ISM Manufacturing Index for December saw a 2.3 point increase in the purchasing manager's index (PMI) to 55.9, sending it to the highest level of the year. (Any score above 50 indicates manufacturing expansion.) By contrast, the PMI in January of 2009 was 35.6, indicating severe contraction.
This marks the fifth straight month of expansion in the PMI, as shown in the chart from ISM below.
Source: ISM
Other indicators also remain strongly positive, with new orders up for the sixth straight month, and production growing for the seventh straight month. Pundits were a bit worried that this month's report showed no increase in order backlogs, but other than that the ISM data looks very bullish for manufacturers and gives hope we can forget about the awful year of 2009 soon enough.
What is your reaction to the manufacturing data here? Could 2009 have been a worse year? What is uyour forecast for 2010? Let us know your thoughts at the Feedback button below.
SCDigest is Twittering!
Follow us now at https://twitter.com/scdigest
|