Supply Chain Trends and Issues: Our Weekly Feature Article on Important Trends and Developments in Supply Chain Strategy, Research, Best Practices, Technology and Other Supply Chain and Logistics Issues  
 
 
  - August 25, 2009 -  

Supply Chain News: A Deeper Look at 2008 Inventory Numbers


pdf of this article


Over Past Two Years, Life Science Areas Show Major Improvements; Progress in Consumer Goods-to-Retail Mostly Stalled


SCDigest Editorial Staff

SCDigest Says:

It stands out to us that companies in the medical/pharma-

ceutical/personal care industries seem to have put a great emphasis on inventory management, as several sectors in that area are near the top of the improvement list.


Click Here to See Reader Feedback

Last week, SCDigest Editor Dan Gilmore gave an overview of the annual Working Capital report from CFO magazine and REL, specifically focusing on the Days Inventory Outstanding (DIO) component of the overall Working Capital numbers. (See Analysis of the Inventory Numbers for 2008.)


Today, we take a deeper look at some of the numbers. The detailed tables, including individual company data, are available at the CFO web site: 2008 CFO/REL Working Capital Report.


One of the three components of working capital performance is inventory efficiency (the other two are concerned with how fast you get paid by customers – Days Sales Outstanding - and how fast you pay your vendors – Days Payable Outstanding). If you are really good at all three, you have reduced your working capital requirements, which frees up more cash for the business – sometimes a lot more.


The measure CFO uses for inventory performance is Days Inventory Outstanding (DIO) – it measures how many days of sales (i.e., the average day) a company holds in inventory. It is, in a sense, the mirror opposite of the familiar “inventory turns” metric. High DIO is bad, in general, while high turns are good, and vice-versa.


In the CFO/REL analysis, DIO is based on year-end inventory numbers and, as such, is subject to some manipulation. Still, it is a reasonable approach to use for analysis, especially over time. The specific formula is: Inventory/(total revenue/365), or year-end inventory divided by one day of average revenue, to put it into words.

Some argue that DIO should be calculated by using cost of goods sold, rather than revenue to calculate DIO, but CFO/REL does it this way, in part for consistency across its three measures related to working capital, which are also based on an average day’s revenue.

In addition, note that the sector numbers are based on the median DIO for the companies in that sector, as opposed to the average. There are both pluses and minuses to using the median number.


(Supply Chain Trends and Issues Article - Continued Below)


CATEGORY SPONSOR: SOFTEON


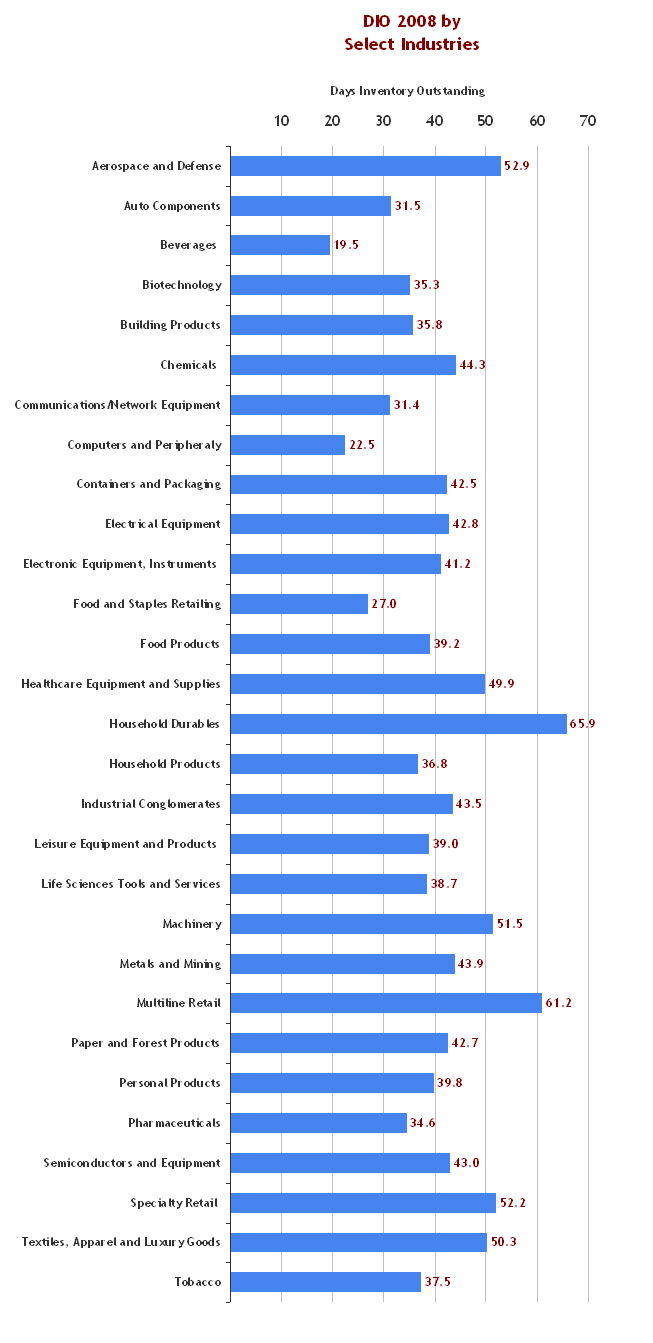
Below we have charted the DIO, using the CFO formula, for select industries, focusing only on those that have a physical product supply chain, as opposed to banking and other non-physical product service sectors.


Changes Across Sectors

We also thought it would be interesting to look at changes in DIO over the past three years, as charted below. The change was calculated by subtracting the 2008 number from the 2006 number. Therefore, positive numbers are good (lower DIO), and negative numbers indicate declining performance.


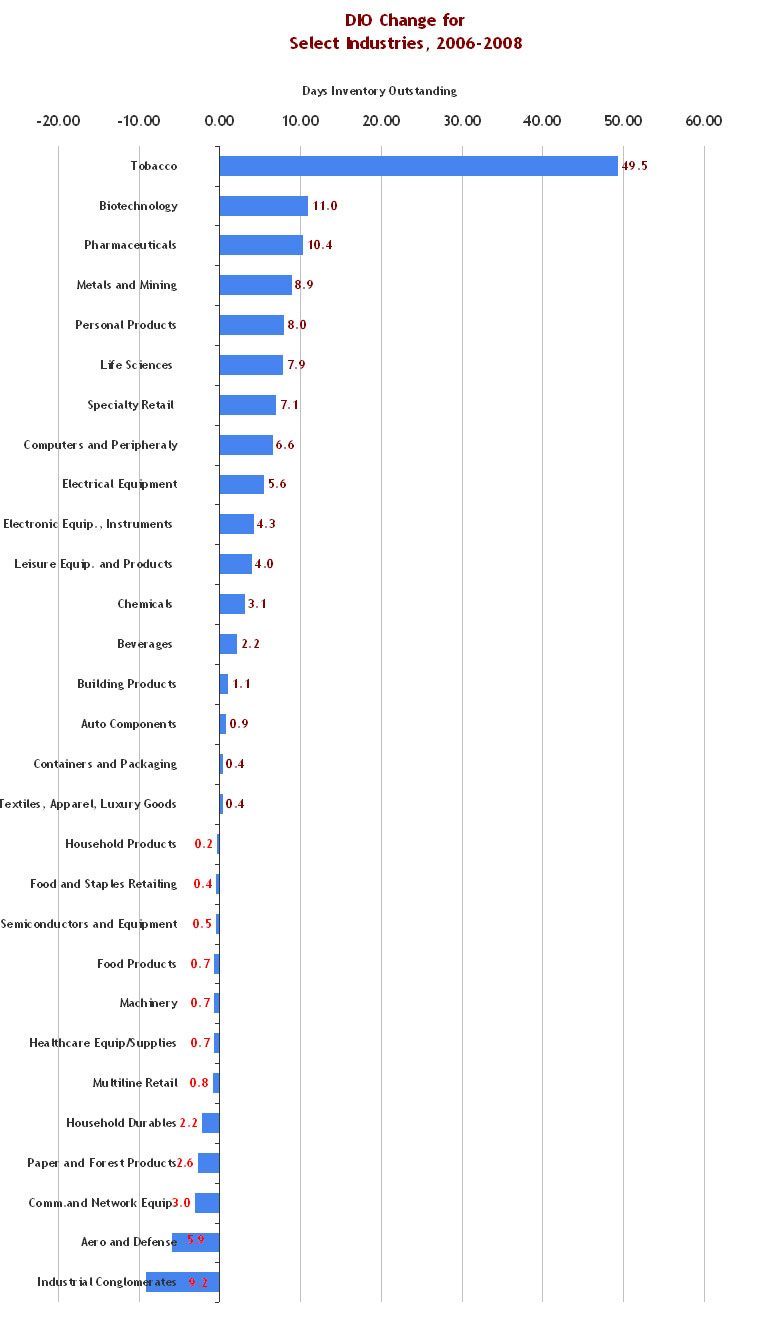
The tobacco industry number is an outlier, as in a sector with a relatively few number of companies, a major improvement by one company, Altria, really moved the median number lower between 2006 and 2008.

It stands out to us that companies in the medical/pharmaceutical/personal care industries seem to have put a great emphasis on inventory management, as several sectors in that area are near the top of the improvement list. The Biotech sector (e.g., Amgen, Gilead) was especially impressive, as the approximate decrease in DIO by 11 days represents about a 25% improvement over the two years.

Specialty retail, which includes a wide range of types of retailers that, as a group, was known as often having perhaps excessive inventory levels, made great strides as well, moving from a DIO of about 59 in 2006 to around 52 in 2008, for an improvement of 12%.

We were surprised, in a sense, that consumer packaged/household products, food manufacturing, and broad line retail (mass merchants and department stores), were all in slightly negative over that period.

Those are the numbers. You can compare the change in the second chart to the 2008 numbers in the first chart to get a sense of percentage changes as well.


Any reaction to the 2008 inventory numbers? Was 2008 such a strange year that it is hard to really draw strong conclusions around inventory management trends? What do you think the 2009 numbers will show? Let us know your thoughts at the Feedback button below.


SCDigest is Twittering!

Follow us now at https://twitter.com/scdigest

 
Send an Email


.