So, how much did truckload and less than truckload (LTL) rates really chainge in 2011? As we continuously look here at SCDigest at estimates on rate ups and downs, there actually seems to be some fairly large discrepancies depending on the source - though it is likely some of those differences in the end could be explained by specifics of the methodology used or the data source.
As just one example, the Cass Truckload Linehaul Freight Index, a measure of rates per mile for TL carriage, was calculated in December as being 8.6% above the previous year, a rather substantial gain in rates for all of 2011.
And the Cass numbers should be very good - the company says the data is based on processing freight bills totalling some $20 billion annually. That is quite a base of information.
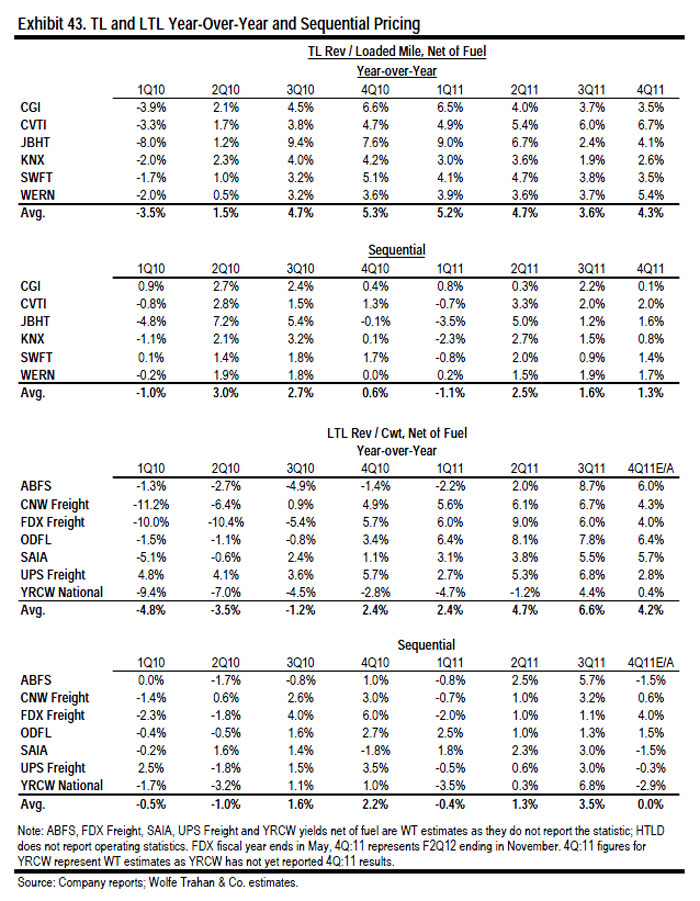
But in looking at the data which the public TL carriers actually reported for Q4 seems to show a different story. As shown in the chart below, the six public carriers that are followed by the transportation analysts at investment research firm Wolfe Trahan showed that on average, TL rates were up for the full year of 2011 by 4.3%, at least as measured by revenue per ton mile (which Wolfe Trahan does use as a proxy for rates).
As can be seen, however, there are some wide differences among the carriers, ranging from rates up just 2.6% year over year for Knight Transportation (KNX), and a whopping 6.7% at Covenant Transportation (CVTI). ( A list of which carriers are represented by what stock symbol is provided below the graphic.)
Readers might also note that TL rates have been up rather sharply year over year every quarter since Q3 2010.
On the LTL side, rates were up year over year an also healthy (at least from the carriers' perspective) 4.2% in Q4, marking the third straight rather strong rate performance for the generally beleaguered sector.
So why in this case the discrepancy between the Cass number and the publicly reported ones? Well first, we aren't sure the Cass Index and the rate per ton mile as reported by the carriers actually measure the same thing. But we are checking on it.
Second, the Wolfe Trahan numbers come from a rather small group of six carriers, albeit most of the larger ones except privately held Schneider National. Could rates have risen more sharply across a broader group of carriers? Maybe so.
The Wolfe Trahan chart above comes from its latest quarterly State of the Freight report, which we covered in some detail earlier this week. See Latest State of the Freight Report Finds Rate Expectation Rising Again Across Most Modes.
Carrier codes:
CGI: Celadon
CVTI: Covenant Transportation
JBHT: JB Hunt
KNX: Knight Transportation
SWFT: Swift
WERN: Werner
ABFS: ABF Freight/Arkansas Best
CNW Freight: Conway Freight
FDX Freight: FexEx Freight
ODFL: Old Dominion
SAIA: Saia
UPS Freight
YRCW National
Have a comment? Send it at the Feedback button below.
|


