We were very interested in this recent chart from the analysts at Scotiabank, who produce a commodity price index that tracks the cost of 32 different commodities, from oil to metals to potash and agricultural items.
Corporate executives have been complaining about rising input costs for quite awhile now - and it appears with strong justification, as most supply managers know.
The chart below from Scotiabank shows the long term movement in its index level, with the year 1997 being set as the base year, with an index value of 100.
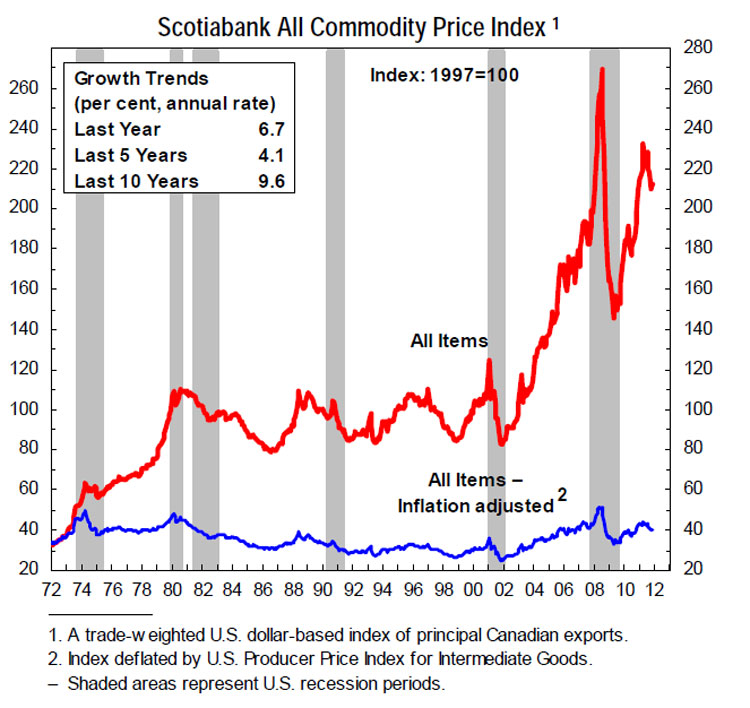
As can be seen, after about a two decade long period of relative flatness (1980-2000), commodity prices really started to soar in 2002, and have risen at an annual compounded rate of 9.6% since then.
That is pretty steep - how many companies have seen compounded revenue growth of 10% in that same period?
Prices are also up in the last 5 years, with a CAARG of 4.1%, even with the price collapse during the recession, and were up 6.7% on average across all index items in 2011.
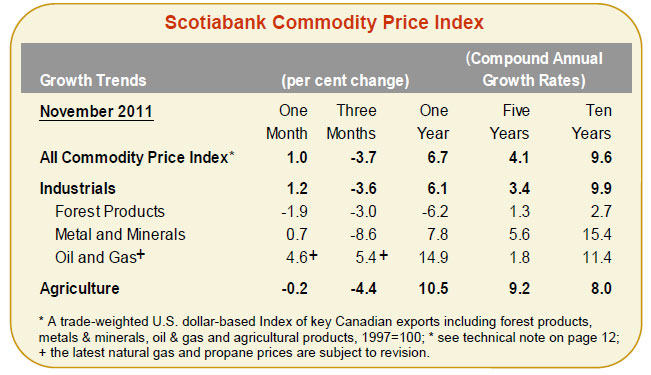
Below is another view that breaks out price trends in a little more detail by commodity type.
Most experts, however, are forecasting slightly declining commodity prices for 2012 over fears of a slowdown in the global economy, driven by woes in Europe.
Have a comment? Send it at the Feedback button below.
|


