Which way is the US economy headed? The question now seems to be between slow, very modest growth and double dip recession, as a variety of domestic and global concerns weigh on the economy not only here but around the world. Even China's manufacturing sector has recently showed decline.
Each month or in some cases quarter, the 12 Federal Reserve districts in the US publish some kind of analysis for their regions, usually both from an overall economic perspective and also usually from a manufacturing sector viewpoint.
We learned this week after looking at many of the web sites for these Fed districts that there is no real consistency in how each one measures and reports this data, but in total they can offer a pretty good snapshot of the economy, which we would say from looking at the charts below is mixed at best and in many respects deteriorating,
The charts below are from reports on manufacturing from five of the Fed districts. They were all released in the last couple of weeks, and cover through the month of July.
Federal Reserve Bank of Philadelphia Manufacturing Analysis
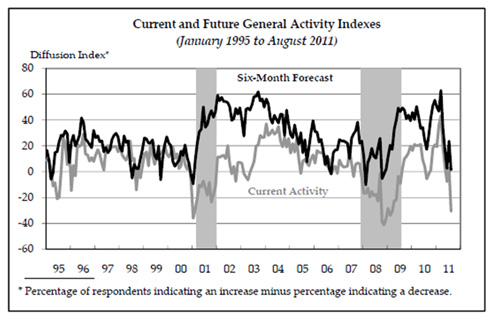
The report from the Philadelphia Fed caused the most concern, with a significant drop both in recent months and especially in July in both current activity and a expectations for the future. As in all of these reports, a score below 0 means contraction, above 0 expansion, though as in the case here recently expansion at declining rates. Future expectations are key because of their impact on hiring and investment.
Federal Reserve Bank of Richmond Manufacturing Analysis
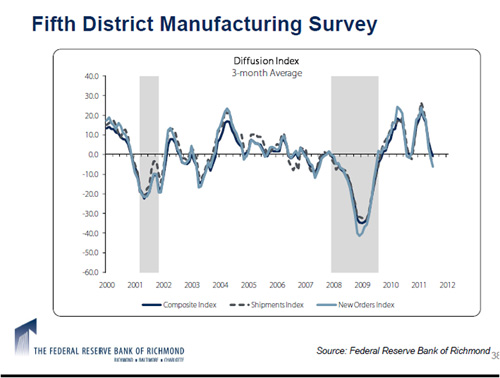
A similar though not quite as bad a reading from the Richmond district. Shipments and orders have been rising at a declining rate since the start of 2011, touching into negative territory in July.
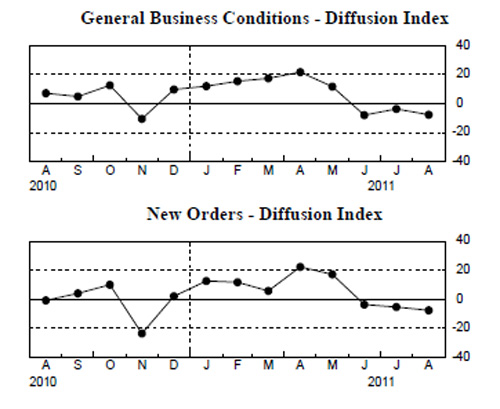
Federal Reserve Bank of New York Manufacturing Analysis (Two Sets of Charts)
Current Conditions
Future Conditions (Six Months)
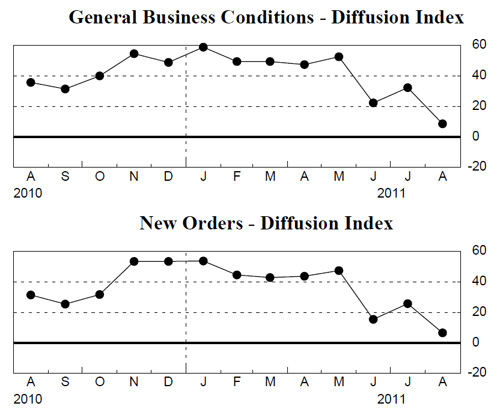
"General business conditions" and orders both dropped into contraction territory in July in the Empire State survey, and fell to near 0 in terms of future expectations, meaning flat growth. The August numbers represent results from July.
Federal Reserve Bank of Dallas Manufacturing Analysis
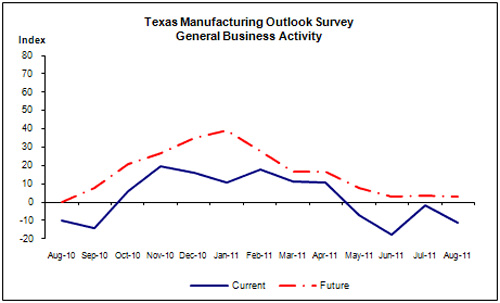
In the Dallas district, current conditions have been below 0 for several months, and took a dive back further down for July after rising to near 0 the previous month. Expectations for the future have bottomed out for now at just above 0 for several monhts.
Federal Reserve Bank of Chicago Manufacturing Analysis
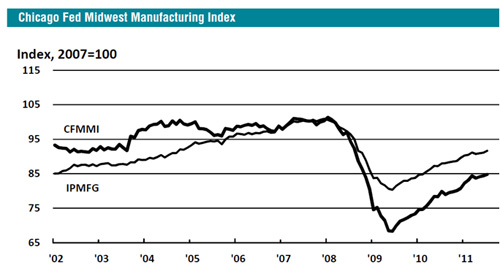
We saved the best news for last, from Chicago, which shows manufacturing output both local district (CFMMI) and national (IPMFG) continuing a mostly rising trend again in July. There is some explanation in the seeming dichotomy of most districts reporting slower growth or decline while overall industrial production nationally shows gains. The auto sector had a good month in the July, which benefited some areas, such as the Chicago district, much more than others.
So what are the takeaways from the Fed district reports?
1. The economy teeters and appears to be headed down, though there is still a chance a double-dip recession can be avoided. A lot will depend on the the debt situation in Europe plays out, which is anyone's guess.
2. For what is now said to be a small share of the US economy, manufacturing sure received a lot of attention and implied importance from each of these Fed districts.
This analysis is consistent with numbers released today by the Institute for Supply Management and its Purchasing Managers Index, which declined in August to a reading of 50.6, but remained (barely) in expansion territory (anything above 50). Many pundits had expected a reading of 48/5, indicating manufacturing contraction.
Have a comment? Send it at the Feedback button below.
|


