Last week, SCDigest editor Dan Gilmore again analyzed the annual working capital scorecard data from Hackett Group/REL, focusing as always on the Days Inventory Outstanding (DIO) component of corporate working capital performance.
We included a couple of charts in that article (see
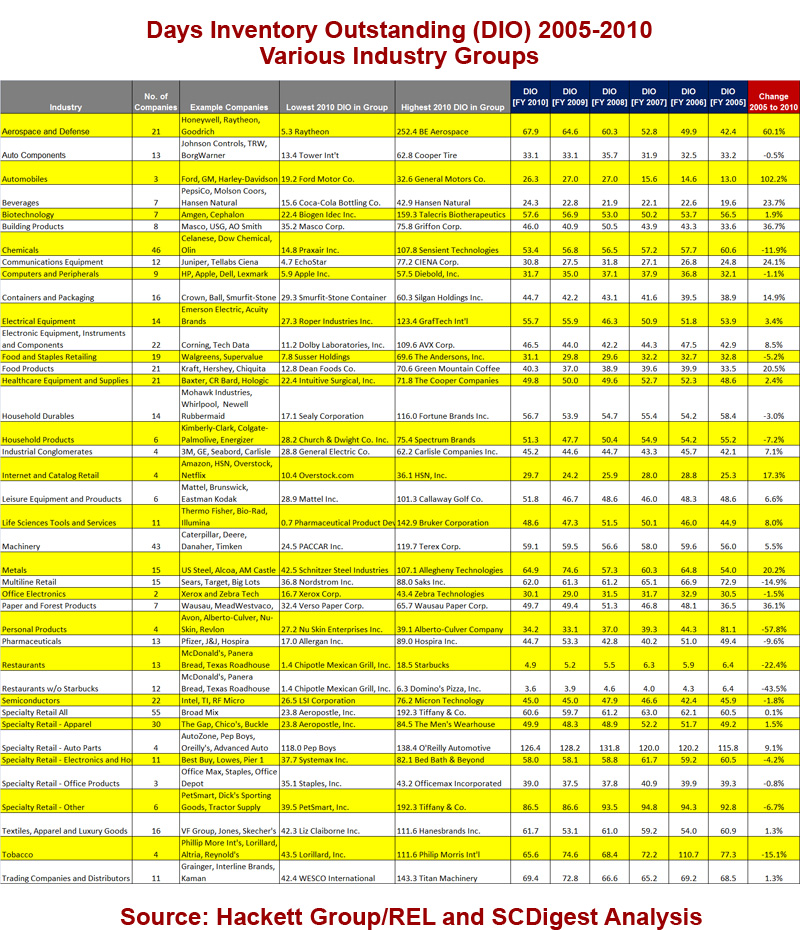
Inventory Performance 2011) relative to changes in DIO over time, but this week we offered another graphic that looks at DIO perforrmance by industry sector from 2005 to 2010, based on the REL data.
That chart is shown below.
It lists each sector we analyzed, the number of companies in the sector, example companies in the group (or all companies if four or less in the sector), the companies with the lowest and highest DIO figures for 2010, average DIO totals for 2005 to 2010 for each sector (in reverse order), and finally the change for the sector from 2005 to 2010.
This graphic is also available here as a pdf document.
Here are our observations from this data:
* 12 of the 40 industry sectors we reviewed decreased DIO 3% or more in 2010 from the 2005 totals
* 11 sectors saw basically flat DIO changes of +/- less than 3%
* 17 sectors saw DIO increase 3% or more over the period.
* There can be some aberations in the data. For example, the top improvement number among sectors over the period was the average 57.8% decrease in DIO in the personal care products category. However, the 2005 number was artificially high based on a very hgh number from Alberto-Culver, which in turn was probably the result of some accounting peculiarity.
* Restaurant chains, multi-line retail chains,and chemical companies seemed to make true and consitent progress in reducing inventory levels over the six-year analysis horizon.
* Conversely, among the sectors showing 3% or greater increases DIO over the period, most were up and down over the six years, not showing any particular pattern. The one exception is Aerospace and Defense, where there is a progressive increase in DIO over the period, for reasons not immediately clear. One possible reason is that the US Dept. of Defense in recent years has asked major suppliers to take on more direct responsibility for spares management, and perhaps that has affected the numbers.
* We are surprised the food manufacturing sector hasn't seen more progress over the period, given the focus on inventory reduction in that industry in recent years.
The bottom line is that few sectors have made real progress since 2005, for reasons that are not readily apparent. The sharp rise in oil prices during this time could be one factor, as companies decided to trade off more inventory to reduce transport costs.
|


