SCDigest editor discusses some supply chain finance 101 concepts in this week's First Thoughts column, trying to sort through the often confusing areas of working capital, cash flow, inventory carrying costs and more (See A Little Supply Chain Finance 101).
There, he referenced a chart developed a number of years ago in an SCDigest white paper, done in collaboration with Gerry Marsh of
High-Tech Analyst Group, and shown below.
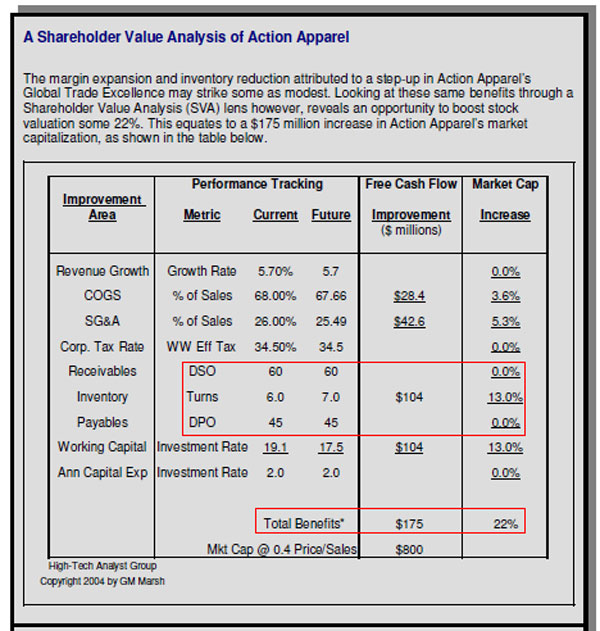
Here, we just want to focus on one thing - the impact of inventory reduction on a fictitious company, Action Apparel (which was a composite model of several athletic apparel companies, based on public financial data).
Through various improvements in its global supply chain, Action Apparel was going to reduce its costs and improve its earnings signficantly, which wll impact its share price, all things being equal (e.g., not considering overall market fluctuations, other company developments, etc.).
But notice the data in the red box in the graphic - the improvement in inventory turns from 6 to 7 per year will reduce inventory levels such that the present value of Action Apparel's future cash flows increases by $104 million, including both the drop in inventory investment directly and the operational savings that also come with the lower inventory levels (using a total inventory carrying cost of 19%).
These inventory improvements will increase Action Apparel's market capitalization by 13%, or more than half of the 22% of the total increase in shareholder value that is expected from a series of global supply chain initiatives in this fictious case study. Besides inventory, improvements were projected in cost of goods sold (COGS) and overhead (SG&A), as seen in the graphic.
In all cases, the improvements are in discounted (present value) cash flows Action Apparel will generate in the future.

How can this be? Marsh notes that "buy side" analysts rely heavily on cash flow based models to estimate a company's value, and that if a company that makes permament changes in the amount of cash it can throw off per dollar of revenue, that will have a powerful effect on those financial models and thus what the analysts believe the company is worth.
Very few companies well understand this.
Agree or
disagree? What is your perspective? Let
us know your thoughts at the Feedback button
below.
|