Doing the job I do has many challenges, but often too some interesting rewards.
Just a couple of months ago, I started thinking about the concept of supply chain tradeoff curves. In my opinion this is a topic that is vastly under-examined and not well understood beyond a sort of surface level.
You are not very far into your supply chain education - probably starting in many cases with textbook no. 1 - before as a student you are exposed to this core concept. The basic notion: there are tradeoffs that must be managed between two variables or outputs - say inventory levels and customer service. At any point in time, if a company decides to reduce inventory levels, that gain will result in a deterioration of service levels, or vice versa - improving customer service will take higher inventory levels. As the name says, it's a tradeoff, moving along the curve in one direction or the other, by chance or strategy.
Gilmore Says: |
 So the key point is that it is generally hard not just to get to the curve itself from where your current dot is really at in the attainable region, as discussed above, but it in some cases it can be challenging even to move along the curve. So the key point is that it is generally hard not just to get to the curve itself from where your current dot is really at in the attainable region, as discussed above, but it in some cases it can be challenging even to move along the curve.

Click Here to See
Reader Feedback |
Ditto with transportation costs versus inventory levels, or more fundamentally supply chain cost versus service. There are others (e.g., manufacturing agility versus cost).
But after seeing these classic tradeoff curves in college, as a core concept in supply chain theory, do we ever see or use them again? Not much if at all, in my experience.
So pondering this just this past July, I emailed Dr. Michael Watson of Northwestern University and his new firm OpEx Analytics, Watson is also a regular SCDigest contributing writer and a true world class analytics expert. My question: are tradeoff curves real?
His answer: "I believe they are very real. I also believe that you can shift the curves with innovative technology or processes-- but even then there are still trade-offs you must manage."
So we agreed this was a topic worth exploring in more detail, though we haven't returned back to it in the intervening weeks.
So this week I am at the excellent Logility software Connections user conference in San Diego, and run into Dr. Sean Willems, who is simply one of the sharpest minds we have today in supply chain. Willems co-founded inventory optimization company Optiant, which Logility acquired a few years ago. He remains Logility's chief scientist, and just recently left his alma mater MIT to take the position as the Haslem chair of supply chain analytics at the University of Tennessee. Let's just say his credential are pretty solid.
Willems was giving a conference keynote presentation the next day after I ran into him. What's the topic going to be, I asked at the evening reception.
"Tradeoff curves," he tells me. My supply chain spider sense is tingling a bit. Willems has been thinking hard about tradeoff curves for the last few years, it turns out.
His presentation, which I will do my best to summarize here, was outstanding. I will start by noting that Willems likes to use the concept of supply chain "efficient frontiers" in place of tradeoff curves, which I will explain in just a bit.
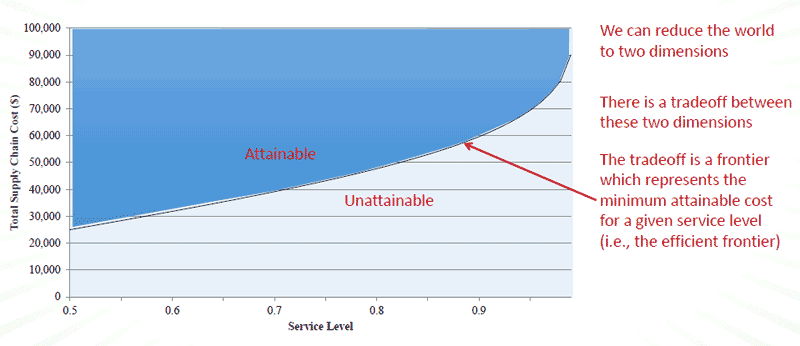
He used the graphic below to illustrate how this concept is usually presented, using the supply chain cost versus customer service tradeoff.

Source: Sean Willems
This curve should look familiar - but with a bit of a twist. The tradeoff curve itself represents what is achievable today, based on current resources, technology, etc. But importantly, that does not mean that a company is currently operating on its true curve. The "dot" representing current cost and service performance could be anywhere "attainable" region - and the farther away from the curve that dot is, the worse the supply chain organization is currently performing.
That is why Willems uses the term "the efficient frontier" - the curve represents the border line between the attainable (lowest cost for a given service level) and the unattainable (again given current resources). And he adds that even getting to that efficiency curve from where a company is really operating today is generally not easy.
"If it was, we'd just do it," Willems noted.
 He gave another example. Is there a tradeoff between the "cadence" of supply chain planning and supply chain costs? Now that is an interesting question. In other words, if a company moved from monthly S&OP to say weekly S&OP, would that deliver lower supply chain costs? He gave another example. Is there a tradeoff between the "cadence" of supply chain planning and supply chain costs? Now that is an interesting question. In other words, if a company moved from monthly S&OP to say weekly S&OP, would that deliver lower supply chain costs?
It might, Willems said, as there is less latency of information between planning cycles. But maybe it's the opposite. The planning might actually become less efficient by trying to do it so frequently, and maybe costs would actually increase with a faster cadence.
Willems then made the key point - a given company has no idea what lies to the left or right (faster or slower cadence) of using a monthly planning cycle. And circling around, this fact is in large measure why I ask Watson if supply chain curves are real back in July. My mind was in the same place as Willems described this scenario in San Diego.
And this, Willems said, is where analytics can play a key role. Analytics can create that curve of tradeoffs between the planning cadence and supply chain costs (or numerous others), calculating for example where and if more frequent planning would have improved decision making that lowered costs - or the opposite.
I am not sure if this is a generality or for some specific company, but Willems then showed a chart that indicated the optimal planning cadence was actually about 22 days - let's say three weeks - rather than a month. But again, for most companies, making this change from monthly to three-week S&OP cycles would take a major effort and process change, and would obviously not be without risk.
So the key point is that it is generally hard not just to get to the curve itself from where your current dot is really at in the attainable region, as discussed above, but it in some cases it can be challenging even to move along the curve.
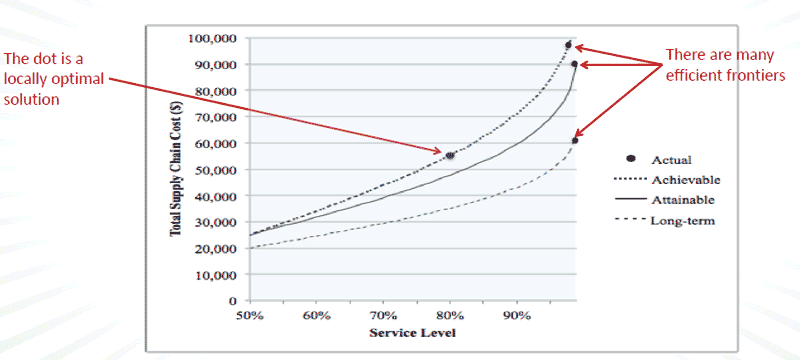
Now let's get back to the efficient frontier. There isn't one curve, Willems says, but several - and this gets to the point of not moving along the curve, but fundamentally shifting it - lower costs and better service at the same time.
That is shown in the image below. A small shift from the current efficiency frontier Willems calls the "attainable" - what a company can achieve in immediate term, with small changes to resources, operating policies and better use of technology.

Source: Sean Willems
But then there is long term curve, or what I might suggest Willems should call the "aspirational." This is a major shift of the curve, what a company can do in the future, with a business case that justifies changes to resources, operating policies and in my experience also usually a major change in supply chain technology.
I am out of space, but am very excited about where this can go, both from Willems' own research and some things we are going to do in SCDigest, now re-energized on this topic. Maybe some collaboration between several of us.
But I will sum it up like this: being a curve shifter is simply what supply chain excellence - and generally supply chain transformation efforts - is all about. More soon.
Any reaction to this discussion of supply chain tradeoff curves and the efficienct frontier? What can you add to the discussion? Let us know your thoughts at the Feedback button (email) or section (web form) below.

|