It was a decent but far from spectacular year for US manufacturing in 2017, at least in terms of output.
Supply Chain Digest Says... |
 |
| The PMI usually tracks well with US GDP, which came in at a strong 3.2% in Q3 and 3.1% in Q2. |
 |
What do you say? |
| Click here to send us your comments |
 |
| Click here to see reader feedback |
|
|
The monthly index number on US manufacturing production from the Federal Reserve came in at a level of 104.8 in November. That was up 2.4 percent from the number for November 2016, and is the most recent data point from the Fed for a year in which the index rose gradually, with the usual ups and downs for any given month
The seasonally adjusted November score of 104.8 compares to level of 102.9 in January. All 11 months in 2017 showed output up on a year-over-year basis, but generally by just a percentage point or less until October and November, where the increase was more like 2%.
But as shown in the interactive graphic below, that means that November US manufacturing output is just 4.8% above the average month in the baseline year of 2012, indicating very weak annual growth of less than 1% in the five years since.
What’s more, as can also be seen in the chart, that also means 2017 output remains well below the peak year of 2007, when the index reached an historic peak of 110.0 in December.
The index scores were also higher in 2006 and the first half of 2008 versus 2017 scores.
November US factory utilization came in at 76.4%, a bit above the 75.1% in November 2016, with the metric also trending up a bit in recent months.
But that means that capacity utilization is still about 2 percentage points behind the long-run, 40-year average of 78.4%. That seemingly small delta actually means a great deal, especially in terms of pushing prices and usually wages higher as capacity tightens.
(Article Continued Below)
|
CATEGORY SPONSOR: SOFTEON |
|
|
| |
|
|
However, the US purchasing managers index from the Institute for Supply Management, which also measures manufacturing activity, generally showed more bullish conditions.
As seen in the chart below, the PMI was easily above the 50 mark that separates manufacturing expansion from contract for every month in 2017, with August through November reaching strong scores above 58 each month, capped by a score of 58.3. The monthly average was a solid 57.4.
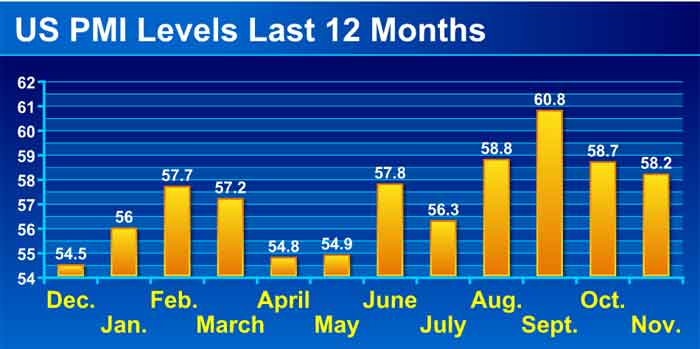
Source: Institute for Supply Management
The PMI usually tracks well with US GDP, which came in at a strong 3.2% in Q3 and 3.1% in Q2, with most observers predicting Q4 numbers will also be strong.
So some conflicting data on the state of US manufacturing in 2017, though it is clear there were gains, the question being just how much.
Any reaction to this data in US manufactring? Let us know your thoughts at the Feedback section below.
Your Comments/Feedback
|