Which US states are best for manufacturing?
The researchers at Ball State University's Center for Business and Economic Research, with its partners at an organization called Conexus Indiana, have as usual released their 2017 Manufacturing and Logistics Report Card.
Among other insights, the report rates each US state in terms of its attractiveness for manfacturing based on nine different factors, from current momentum in growing and attracting manufacturing to the tax environment to logistics support and more.
The report gives each state a grade from A to F on each of the nine factors, including pluses and minuses, and indicated whether that score is up, down, or flat from the previous year. But oddly, it does not produce a summary score and rankings across all the attributes.
SCDigest to the rescue. We took the Conexus Indiana data and assigned a numeric score to each letter grade, the way it is typically done to produce a school grade point average:i.e., A = 4.0, A- = 3.7, B+ = 3.3., etc.
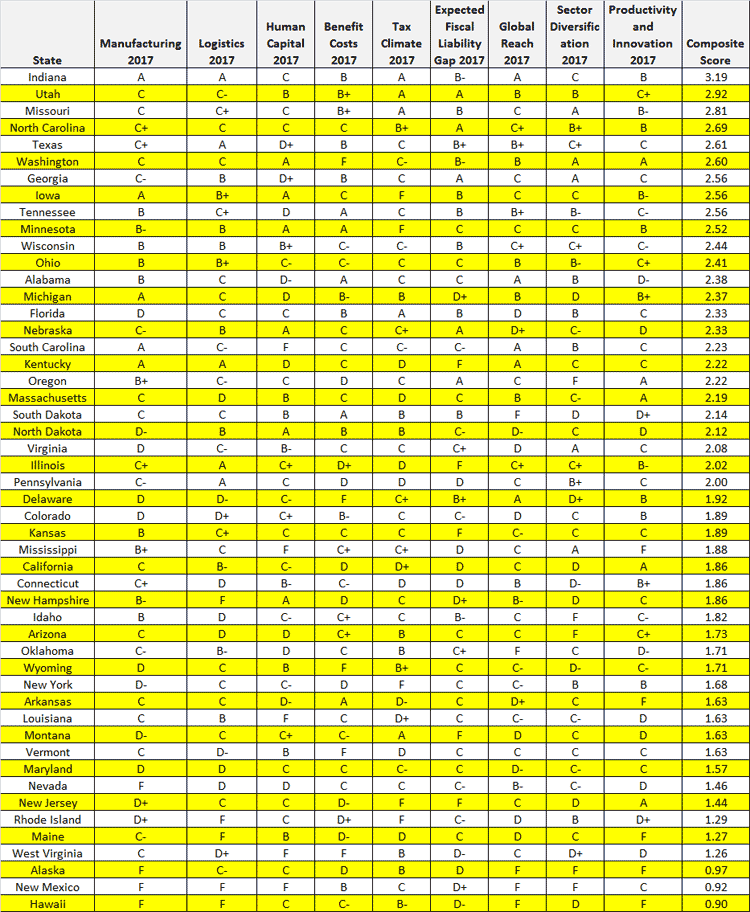
The scores for each state were then average evenly across categories, producing the best to worst ranking, as shown in the table below:
Composite Scores of the Best States for Manufacturing 2017

Source: SCDigest Analysis from 2017 Manufacturing and Logistics Report Card Date
As can be seen, under this system, Indiana comes out on top, with roughly a B+ composite average, followed by Utah, Missouri, North Carolina and Texas.
Hawaii was dead last, barely ahead of New Mexico, with roughly D- scores.
Was the fix in for Indiana in the research? SCDigest doesn't believe so. The Hoosier state has made itself very manufacturing friendly in recent years, such as approving right to work legisltation and reducing taxes, and indeed has one of the top percent of manufactucturing jobs relative to total jobs of any state in the nation.
The full interesting report can be found here: 2017 Manufacturing and Logistics Report Card
Any Feedback on our Supply Chain Graphic of the Week? Let us know your thoughts at the Feedback section below.
Your Comments/Feedback
|
|
David Pareigis
MFG Engineer, Company |
Posted on: Jul, 27 2017 |
|
| How do you define each of the categories? For example, what characteristics makes up MFG. 2017? |
|
|