My column a few weeks ago on Walmart and Amazon by the Numbers 2020 once again proved very popular. I am very pleased to be backed this week with part 2, as we dig into the data from the world's two most important retailers.
Gilmore Says.... |
 |
| Importantly, Walmart also has to pay a dividend from its cash flow- $6.0 billion worth last year - while Amazon does not. |
 |
What do you say? |
|
| Click here to send us your comments |
| |
|
|
|
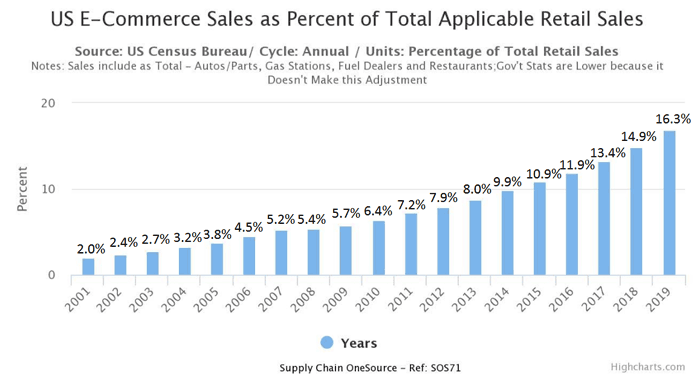
To first put the numbers from both of my columns in perspective, let's first look at the rise of US ecommerce. According to the Commerce Dept., ecommerce sales were about 12% of total retail sales last year, up from about 9.9% in 2018 - but those total retail numbers include sales of cars, gas stations, restaurants and a few other categories that are not really relevant for comparison.
So, we run the numbers based on the same formula we used in part 1 of this series to analyze Walmart's share of US retail, for which we take total retail and subtract out those non-relevant categories . Using that formula, ecommerce sales were a much higher 16.3% of total US retail sales in 2019, up strongly from 14.9% in 2018, as shown in the graphic below. Of course, that share is much higher in some product categories, such as electronics and apparel and growing daily.
The share of ecommerce sales have amazingly taken off even faster this year in the face of the pandemic and the stay/work at home economy.
Even using the Commerce Dept.'s overstated denominator, the government says ecommerce sales jumped from 11.8% in Q1 of this year to 16.1% in Q2. Using my formula that subtracts non-relevant categories, the number would be more than 20%.
This is obviously the key retail battleground.
In my first column, we also graphed the annual percentage growth for Walmart's US retail sales, which slowed noticeably a few years back but have rallied a bit the last few years before a flat 2019. Below we show the Walmart numbers in absolute terms across its three reporting units: US, Sam's Club, and International. All units have seen the pace of growth slow sharply, though US store sales were up a fairly strong 3.0% in 2019. The on-going big slowdown in international remains a bit puzzling.
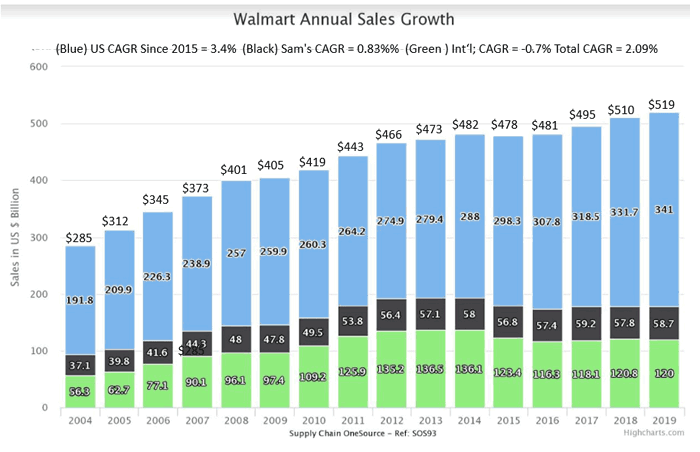
The cumulative average revenue growth rate (CAGR) for each unit and total sales since 2015 is shown above the main chart. Walmart has had a CAGR of 5.1% for total sales from 2002 through 2019, but that clearly came much more from the first half of that period than the last few years. Since 2015, total revenue has grown 2.09% annually, with international actually falling 0.7% per year, Sam's Club basically flat at 0.83% annual growth, and surprisingly the fastest growth in the most mature segment, US retail, at 3.4%. Still the wimpy 1.8% total revenue growth in 2019 represents more than $9 billion in new revenue - and that's a good sized retailer on its own.
Switching gears, Amazon for years received much criticism for its consistent failure to really make any money, but that started to change in 2016 and really jumped in 2018, as can be seen in the chart below. Net income for 2019 was $11.5 billion, up 11.5%, and reached 4.1% of sales, both those numbers easily setting company records.
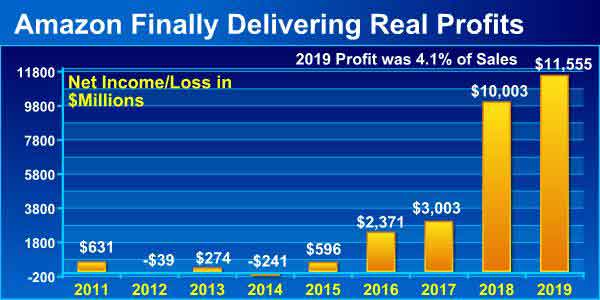
However, it's worth noting that 28% of its operating income came from its AWS web services unit.
Walmart, by comparison, had profits of $14.8 billion last year, not that much more than Amazon, and which represented only 2.8% of sales, lower than Amazon's margin percent.
For years some said to look at Amazon's cash flow from operations instead of profits, a view which has painted a more favorable picture when profits were low.
Operating cash flow as a percent of revenue has generally been much higher at Amazon than at Walmart for many years - and was more than two times so in 2019, as shown in the chart below.
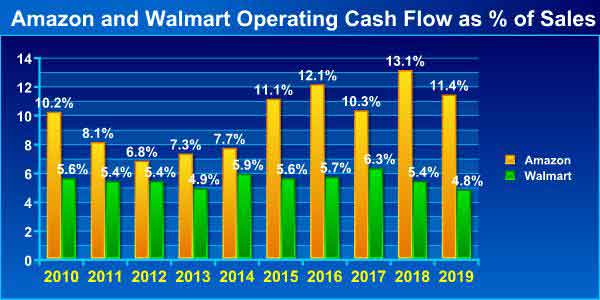
In fact, despite having about half the revenue of Walmart, Amazon again had higher operating cash flow in absolute terms last year, at $32.1 billion versus $25.2 billion for Walmart.
But there is operating cash flow and then what is called "free cash flow," or operating cash flow minus capital expenditures, and here the story is also interesting.
Amazon had that $32.1 billion operating cash flow in 2019, and had CapEx of about $16.8 billion, up from $13.4 billion in 2019. So that means CapEx was 52.3% of operating cash flow, up from 44% in 2018. Lots of fulfillment centers still being built.
Walmart, on the other hand, had CapEx of about $10.7 billion - up just a bit from $10.3 billion in 2018. With $25.2 billion in operating cash flow, that means CapEx of about 42.4% of OCF, though with Walmart now generating less OCF than its rival. (Note: as a proxy for official CapEx, I am using spending on real estate, equipment and technology).
Importantly, Walmart also has to pay a dividend from its cash flow- $6.0 billion worth last year - while Amazon does not. So Amazon's operating cash flow minus CapEx spend = $18.6 billion in 2019. Doing the same calculation with Walmart but also subtracting the dividend leaves it with $8.5 billion in free cash. That is less than 50% of Amazon's total, and is lower for just the second time, with the first in 2018.
The dividend factor is huge and a giant advantage for Amazon while it lasts.
I have lots more, but I am out of space. Hope you have enjoyed this look at the numbers.
Any reaction to these numbers from Amazon and Walmart? Any other data you would like to see? Let us know your thoughts at the Feedback button or section below.
Your Comments/Feedback
|


