My column a few weeks ago on Walmart and Amazon by the Numbers 2018 once again proved very popular, with a number of readers emailing "give us more." That response, plus the fact that I have a lot of fun doing this, brings me back this week, with some additional data and charts.
Gilmore Says.... |
 |
| 62% of Amazon's strong Q2 2018 operating income came from its web services unit, and the folks at the SeekingAlpha web site say on-line store operations are still probably about breakeven |
 |
What do you say? |
|
| Click here to send us your comments |
| |
|
|
|
I will again quickly note that a few readers commented that my first column alerted them to the fact that you really have to dig into almost any numbers reported by someone to see if they make sense and/or understand what they really mean in context, as for example, in my unique analysis of Amazon's shipping costs as a percent of relevant not total sales. I could write a whole column on this point - take few numbers at pure face value.
OK, to first put the numbers from both of my columns in perspective, let's first look at the rise of ecommerce. According to the Commerce Dept., ecommerce sales were about 9.5% of total retail sales last year, up from 8.1% in 2016 - but those total retail numbers include sales of cars, gas stations, restaurants and a few other categories that are not really relevant for comparison.
So, we compute the numbers based on the same formula we used in the last column to analyze Walmart's share of US retail, for which we take total retail and subtract out those non-relevant categories. Using that formula, ecommerce sales were a much higher 13.3% of total US retail sales in 2017, up strongly from 11.9% in 2016. Of course, that share is much higher in some product categories, such as electronics and apparel.
In my first column, we also graphed the annual percentage growth for Walmart's US retail sales, which have slowed noticeably in recent years. Below we show the Walmart numbers in absolute terms across its three reporting units: US, Sam's Club, and International. All units have seen the pace of growth slow sharply, and the recent big slowdown in international is a bit puzzling . Basically, Walmart's total sales are close to flat since 2012.
The cumulative average revenue growth rate (CAGR) for each unit and total sales since 2010 is shown beneath the chart. Walmart has had an average CAGR of a pretty decent 4.46% for total sales from 2004 through 2016, but that clearly came much more from the first half of that period than the last few years. Since 2010, total revenue has grown just 2.43% annually, with international rising just 1.13% per year, and surprisingly the fastest growth in the most mature segment, US retail, at 2.93%, as the law of large numbers is felt company wide. Still the decent 3% total growth in 2017 represents almost $15 billion in new growth - that's a good sized retailer on its own.
Switching gears, Amazon for years received much criticism for its consistent failure to really make any money, but that started to change in 2016l, as can be seen in the chart below. Net income for 2017 was up 28% to a little over $3 billion, though that is still just 1.7% of sales for the second year in a row.
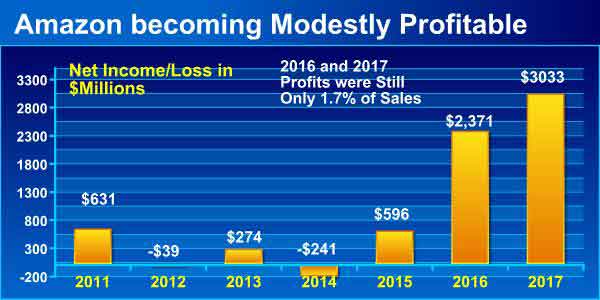
Now you probably heard Amazon had a strong Q2 2018, with profits of $2.5 billion in just one quarter, or 4.7% of its $52.8 billion in sales. However, 62% of its operating income came from its web services unit, and the folks at the SeekingAlpha web site say on-line store operations are still probably about breakeven.
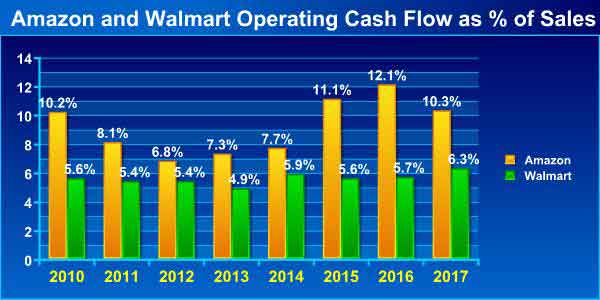
For years some have said to look at Amazon's cash flow from operations instead of profits, which paints a better picture, and indeed operating cash flow has generally had a stronger story than net income, as shown in the chart below. Operating cash flow as a percent of revenue has generally been much higher than at Walmart. Note, however, the consistency of the Walmart numbers, and that it actually saw a nice bump in 2017, while Amazon's number fell.
But there is operating cash flow and then what is called "free cash flow," or operating cash flow minus capital expenditures, and here the story is also interesting.
Amazon had operating cash flow of $18.4 billion in 2017, and had CapEx of about $$11.9 billion, up more than $4 billion from 2016. So that means CapEx was 64% of operating cash flow, way up from from 41% in 2016, though that was something of an aberration.
Walmart, on the other hand, had CapEx of about $10.6 billion - down a bit from 2016 - against $31.6 billion in operating cash flow, or 33%, a much lower percent than Amazon in 2017 after being almost exactly the same ratio as Amazon in 2016. (Note: as a proxy for official CapEx, I am using spending on real estate, equipment and technology). Importantly, Walmart, however, also has to pay a dividend from its cash flow- $6.1 billion worth last year - while Amazon does not. So Amazon's operating cash flow minus CapEx spend = $6.5 billion in 2017( a big drop from 2016). Doing the same calculation with Walmart but also subtracting the dividend leaves it with $14.9 billion in free cash. That is more than double Amazon's total, but Walmart has nearly three times the revenue. But the dividend factor is huge and a giant advantage for Amazon.
In the first column I lamented that Amazon now only provides total shipping costs, not net costs including shipping revenues as it did for years. It also stopped reporting merchandise sales, which I used as the denominator for several ratios, as the best approximation for product sales that require fulfillment and shipping activities.
So I had to improvise, and used what Amazon reports as sales from "on-line stores," then added revenues from what Amazon calls third-party services. That latter number includes commissions the company gets from its marketplace sellers, and revenues from Amazon's third-party logistics services, including Fulfilled by Amazon (FBA). With that number as the denominator, shipping costs in Q4 2017 were 16.1% of relevant revenues - but the number is less meaningful without knowing the net costs.
So I also have been tracking to fulfillment costs for years- basically DC operations plus the depreciation expense for all those buildings and robots, plus inbound freight. Fulfillment costs are reported as a line item by Amazon. Until this year I calculated the ratio of that expense - which doesn't include shipping, by the way - again against merchandise sales. But now I have to do it against my new denominator. By that calculation Q4 2017 fulfillment costs were a whopping 54.6% of my combined relevant number - though it is not as clear what the state of affairs truly is with the new reporting.
I could do more, but think that's enough for awhile - unless convinced otherwise. And next year I will add Alibaba to the mix.
Any reaction to these numbers from Amazon and Walmart? Any other data you would like to see? Let us know your thoughts at the Feedback button or section below.
Your Comments/Feedback
|


